May 20, 2026 a 07:43 pm

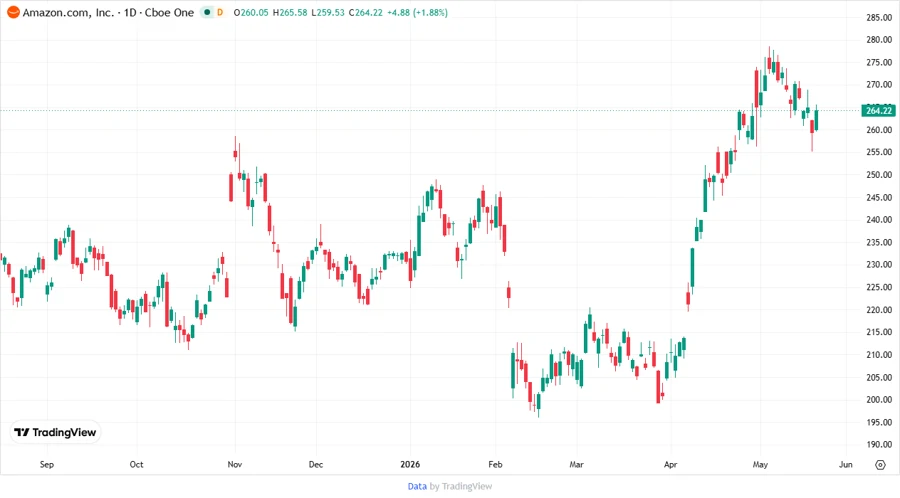
AMZN: Fundamental Ratio Analysis - Amazon.com, Inc.
Amazon.com, Inc. operates a diverse business model that spans retail sales, subscriptions, and AWS services. Despite the challenges of operating in multiple sectors, Amazon continues to exhibit robust growth potential. Analysts generally maintain a positive outlook, supported by the company's strategic expansions and innovations.
Fundamental Rating
The current fundamental analysis of Amazon.com, Inc. shows a balanced score with areas of strength and some opportunities for improvement.
| Category | Score | |
|---|---|---|
| Discounted Cash Flow | 2 | |
| Return on Equity | 5 | |
| Return on Assets | 5 | |
| Debt to Equity | 2 | |
| Price to Earnings | 2 | |
| Price to Book | 1 |
Historical Rating
Comparing recent historical ratings helps evaluate the consistency and progression of Amazon's financial performance.
| Date | Overall | DCF | ROE | ROA | Debt/Equity | P/E | P/B |
|---|---|---|---|---|---|---|---|
| 2026-05-20 | 3 | 2 | 5 | 5 | 2 | 2 | 1 |
| Previous | 0 | 2 | 5 | 5 | 2 | 2 | 1 |
Analyst Price Targets
Analyst price targets provide insight into the expected performance and market sentiment surrounding Amazon stocks.
| High | Low | Median | Consensus |
|---|---|---|---|
| 333 | 175 | 315 | 306.74 |
Analyst Sentiment
Overall analyst sentiment is positive towards Amazon, reflecting confidence in its continued growth and performance.
| Rating | Count | |
|---|---|---|
| Strong Buy | 0 | |
| Buy | 85 | |
| Hold | 8 | |
| Sell | 1 | |
| Strong Sell | 0 |
Conclusion
Amazon.com, Inc. remains a powerhouse in the e-commerce and cloud computing sectors, with strong innovation and market position. While its fundamentals show areas for improvement, the dominant position of AWS and consumer retail indicates significant upside potential. The general analyst outlook remains optimistic, emphasizing growth. However, investors should be mindful of industry competition and regulatory challenges that could impact future profitability. As Amazon navigates these dynamics, the stock offers a combination of steady performance with high growth potential.
Please note that this HTML is designed to be embedded within an existing webpage and omits standalone document structure tags like ``, ``, and ``.
Smart Data Insight
Master the Perfect Entry & Exit for this Stock
Don't leave your profits to chance. Historically, this stock follows specific seasonal patterns that institutional traders use to maximize returns.
- ✅ Identify the "Golden Buying Window"
- ✅ Avoid high-risk correction cycles
- ✅ Backtested data from the last 20+ years