May 04, 2026 a 03:43 pm

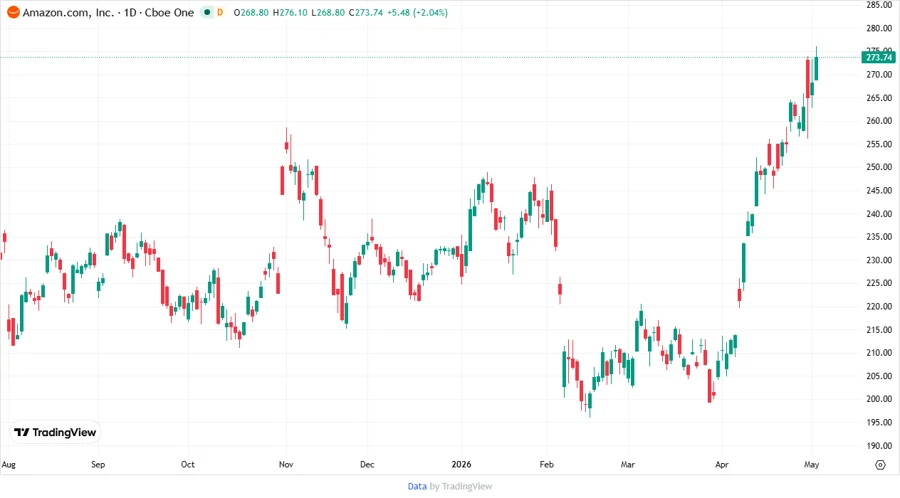
AMZN: Fundamental Ratio Analysis - Amazon.com, Inc.
Amazon.com, Inc. is a major player in the consumer cyclical sector, with significant operations across various segments, including retail, AWS, and media. The stock exhibits a strong position in the market, although it faces challenges related to debt levels and rapidly changing competitive landscapes. Analysts closely watch Amazon's performance due to its influential role in e-commerce and cloud sectors.
Fundamental Rating
Amazon.com's fundamental rating reflects its robust operational metrics, particularly in Return on Equity (ROE) and Return on Assets (ROA), though it faces scrutiny over its Debt to Equity ratio.
| Category | Score | Visualization |
|---|---|---|
| Discounted Cash Flow | 3 | |
| Return on Equity | 5 | |
| Return on Assets | 5 | |
| Debt to Equity | 2 | |
| Price to Earnings | 3 | |
| Price to Book | 1 |
Historical Rating
The comparison of historical ratings offers insights into Amazon's stock performance over time, highlighting shifts in financial robustness.
| Date | Overall Score | DCF | ROE | ROA | D/E | P/E | P/B |
|---|---|---|---|---|---|---|---|
| 2026-05-01 | 3 | 3 | 5 | 5 | 2 | 3 | 1 |
| N/A | 0 | 3 | 5 | 5 | 2 | 3 | 1 |
Analyst Price Targets
Analysts have set varied price targets for Amazon, with a consensus suggesting strong potential for stock price appreciation.
| High | Low | Median | Consensus |
|---|---|---|---|
| $333 | $175 | $315 | $306.77 |
Analyst Sentiment
The sentiment among analysts is predominantly favorable, with a strong inclination towards buying Amazon's stock.
| Recommendation | Count | Distribution |
|---|---|---|
| Strong Buy | 0 | |
| Buy | 84 | |
| Hold | 9 | |
| Sell | 1 | |
| Strong Sell | 0 |
Conclusion
Amazon.com, Inc. continues to be a strong performer in the market, buoyed by its diverse business segments and technological innovations. However, the company faces potential risks related to debt management and increasing competition. Despite these challenges, Amazon's consistent operational success, coupled with positive analyst sentiment, suggests favorable future performance. Investors should consider both the growth potential in AWS and e-commerce sectors and the possible hurdles in maintaining leadership amidst rapid industry changes.
Smart Data Insight
Master the Perfect Entry & Exit for this Stock
Don't leave your profits to chance. Historically, this stock follows specific seasonal patterns that institutional traders use to maximize returns.
- ✅ Identify the "Golden Buying Window"
- ✅ Avoid high-risk correction cycles
- ✅ Backtested data from the last 20+ years