September 01, 2025 a 03:15 pm

AMZN: Fibonacci Analysis - Amazon.com, Inc.
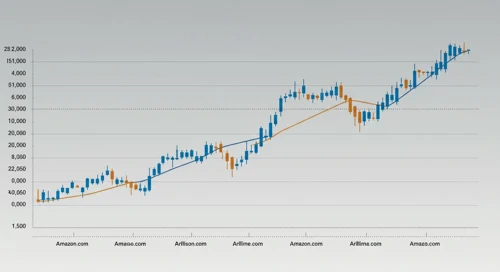
The Amazon.com, Inc. (AMZN) stock exhibits strong bullish momentum in recent months. The company's strategic positioning in e-commerce, cloud computing, and digital content provides a diverse revenue stream, adding resilience to market fluctuations. However, external factors such as regulatory scrutiny and market competition could impact future performance.
Fibonacci Analysis
| Attribute | Details |
|---|---|
| Trend Start Date | 2025-04-21 |
| Trend End Date | 2025-08-28 |
| High Point | $234.11 (2025-07-31) |
| Low Point | $167.32 (2025-04-21) |
| Fibonacci 0.236 | $183.78 |
| Fibonacci 0.382 | $195.11 |
| Fibonacci 0.5 | $200.72 |
| Fibonacci 0.618 | $206.33 |
| Fibonacci 0.786 | $218.93 |
Currently, the price is at $229, placing it above all the Fibonacci retracement levels, indicating a potential continuation of the uptrend. The closest retracement level is 0.786 at $218.93, which can serve as a strong support level.
Conclusion
Amazon.com, Inc.'s continual growth in diverse sectors presents a robust investment opportunity, given the stock’s current trajectory. The stock price exceeding critical Fibonacci levels suggests reinforced investor confidence and a bullish market sentiment. However, potential risks include increased market competition and regulatory challenges. For analysts, it's crucial to continue monitoring these Fibonacci levels as potential support or resistance points and maintain vigilance on external economic influences that might alter the trend.
Smart Data Insight
Master the Perfect Entry & Exit for this Stock
Don't leave your profits to chance. Historically, this stock follows specific seasonal patterns that institutional traders use to maximize returns.
- ✅ Identify the "Golden Buying Window"
- ✅ Avoid high-risk correction cycles
- ✅ Backtested data from the last 20+ years