May 14, 2026 a 09:03 am

AMGN: Trend and Support & Resistance Analysis - Amgen Inc.
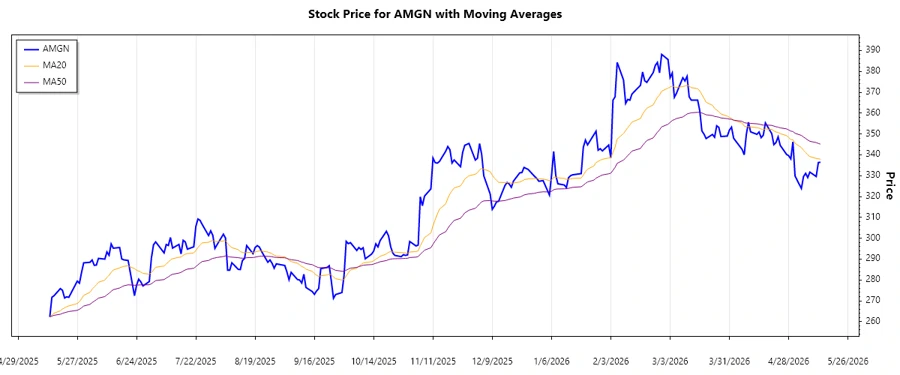
Amgen Inc., a leader in biotechnology, focuses on developing therapeutics in several critical areas such as oncology and cardiovascular disease. Recent price movements indicate fluctuating trends, possibly due to changes in market sentiment or company-specific news. Understanding the technical indicators and support/resistance levels helps investors make informed decisions. In this analysis, we dive into the EMA calculations and upcoming zones to watch for potential trading opportunities.
Trend Analysis
| Date | Closing Price | Trend |
|---|---|---|
| 2026-05-13 | 336.45 | ▼ |
| 2026-05-12 | 336.29 | ▼ |
| 2026-05-11 | 329.59 | ▼ |
| 2026-05-08 | 331.70 | ▼ |
| 2026-05-07 | 329.09 | ▼ |
| 2026-05-06 | 331.11 | ▼ |
| 2026-05-05 | 329.59 | ▼ |
The calculation of the EMAs indicates a ▼ downtrend, as the EMA20 is consistently below the EMA50. This ongoing downtrend suggests bearish sentiment in the short term, potentially presenting opportunities for shorting or cautious buying on anticipated further dips.
Support and Resistance Zones
| Zone | From | To | Direction |
|---|---|---|---|
| Support 1 | 329.00 | 331.00 | ▲ |
| Support 2 | 323.00 | 325.00 | ▲ |
| Resistance 1 | 345.00 | 347.00 | ▼ |
| Resistance 2 | 350.00 | 352.00 | ▼ |
The current price is approaching the 'Support 1' zone, suggesting a test of the support level. Should this fail, the price might move towards 'Support 2', indicating further downside. These zones assist traders in identifying potential entry or exit points based on price reactions.
Conclusion
Overall, the technical indicators for AMGN suggest a continuing downtrend, with EMAs indicating short-term bearish behavior. Support zones could provide opportunities for recovery, but risk management is key in the current setup. Resistance zones ahead could challenge upward price movement, making cautious trading essential. Analysts should monitor these levels closely to validate future trends and adjust positions accordingly.
Smart Data Insight
Master the Perfect Entry & Exit for this Stock
Don't leave your profits to chance. Historically, this stock follows specific seasonal patterns that institutional traders use to maximize returns.
- ✅ Identify the "Golden Buying Window"
- ✅ Avoid high-risk correction cycles
- ✅ Backtested data from the last 20+ years