
November 19, 2025 a 05:15 am
AMGN: Fibonacci Analysis - Amgen Inc.
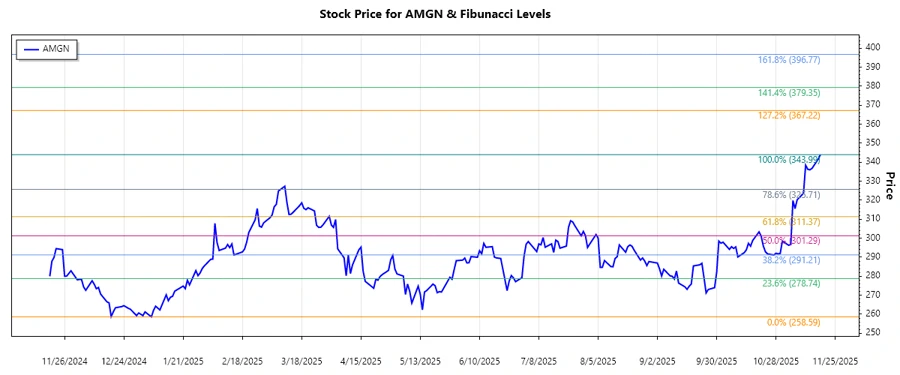
Amgen Inc., a leader in biotechnology, has shown robust performance in recent months with a notable upward trend. The company's focus on innovation in various therapeutic areas positions it well for future growth. Technical analysis indicates significant potential for continued bullish behavior, particularly if the current retracement levels provide strong support.
Fibonacci Analysis
| Start Date | End Date | High Price | Low Price | Fibonacci Levels |
|---|---|---|---|---|
| 2024-11-19 | 2025-11-18 | 343.99 (2025-11-18) | 258.59 (2025-01-06) |
|
As of the latest price data, the current price is near the 0.382 retracement level, which may indicate potential support. If this level holds, it could suggest further bullish momentum.
Conclusion
The analyzed trend for Amgen Inc. reflects a dominant upward momentum over the past year. The recent retracement to the 0.382 Fibonacci level could serve as a pivotal support, providing a foundation for possible continuation of the uptrend. Investors may find this an opportune moment, given the potential for resistance breakout. However, external factors like market volatility and competitive pressures might challenge sustained growth. Therefore, caution and continual monitoring of support levels are advisable.
Smart Data Insight
Master the Perfect Entry & Exit for this Stock
Don't leave your profits to chance. Historically, this stock follows specific seasonal patterns that institutional traders use to maximize returns.
- ✅ Identify the "Golden Buying Window"
- ✅ Avoid high-risk correction cycles
- ✅ Backtested data from the last 20+ years