October 07, 2025 a 03:15 pm
AMGN: Fibonacci Analysis - Amgen Inc.
The stock of Amgen Inc. has been fluctuating in recent months, reflecting a volatile market environment influenced by various factors in the biotech and pharmaceuticals industry. Amgen's significant investments in key therapeutic areas such as oncology and cardiovascular health provide a robust outlook, though competitive pressures remain. Technical analysis suggests a reaction to broader market trends, with the latest data indicating meaningful retracement levels that could offer insights into future price movements.
Fibonacci Analysis
| Detail | Value |
|---|---|
| Trend Start Date | 2025-03-11 |
| Trend End Date | 2025-10-07 |
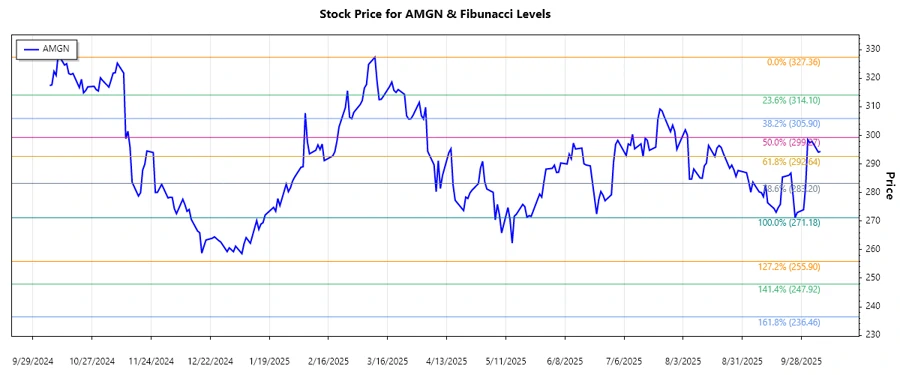
| High Point | 327.36 on 2025-03-10 |
| Low Point | 271.18 on 2025-09-25 |
| Fibonacci 0.236 | 284.85 |
| Fibonacci 0.382 | 292.49 |
| Fibonacci 0.5 | 299.27 |
| Fibonacci 0.618 | 306.05 |
| Fibonacci 0.786 | 315.24 |
The current price of 294.12 as of 2025-10-06 is within the 0.382 retracement level. This suggests a possible resistance level where the price might struggle to breach or retreat from.
The trend analysis implies that there could be a consolidation phase or potential support forming around this level, which is crucial for determining future trend direction.
Conclusion
Amgen's stock shows potential for future gains, yet it faces significant challenges from market competition and economic uncertainties. The Fibonacci retracement reveals critical areas of potential support or resistance, useful for traders in identifying strategic entry or exit points. Analysts should remain vigilant as macroeconomic factors and sector-specific developments could impact Amgen's stock performance. Despite retracement indicators, ongoing research, and pipeline developments continue to provide growth opportunities. Monitoring these aspects is vital for understanding the stock's long-term trajectory.
Smart Data Insight
Master the Perfect Entry & Exit for this Stock
Don't leave your profits to chance. Historically, this stock follows specific seasonal patterns that institutional traders use to maximize returns.
- ✅ Identify the "Golden Buying Window"
- ✅ Avoid high-risk correction cycles
- ✅ Backtested data from the last 20+ years