May 14, 2026 a 02:46 am

AMGN: Dividend Analysis - Amgen Inc.
Amgen Inc. showcases a robust dividend profile with stable growth over the years. With a historic commitment to rewarding shareholders, Amgen's dividend yield and growth metrics signal a resilient and investor-friendly strategy. Caution is advised regarding the payout ratio, suggesting the company might stretch its earnings. However, the overall financial metrics point towards a solid long-term investment potential in the healthcare sector.
📊 Overview
Amgen, a leading entity in the healthcare sector, demonstrates a promising dividend yield of 2.91%, with a current dividend per share of $9.52. This is supported by a commendable dividend history of 16 years, without any recent cuts or suspensions, signifying the company's commitment to returning value to its shareholders.
| Metric | Value |
|---|---|
| Sector | Healthcare |
| Dividend Yield | 2.91% |
| Current Dividend Per Share | 9.52 USD |
| Dividend History | 16 years |
| Last Cut or Suspension | None |
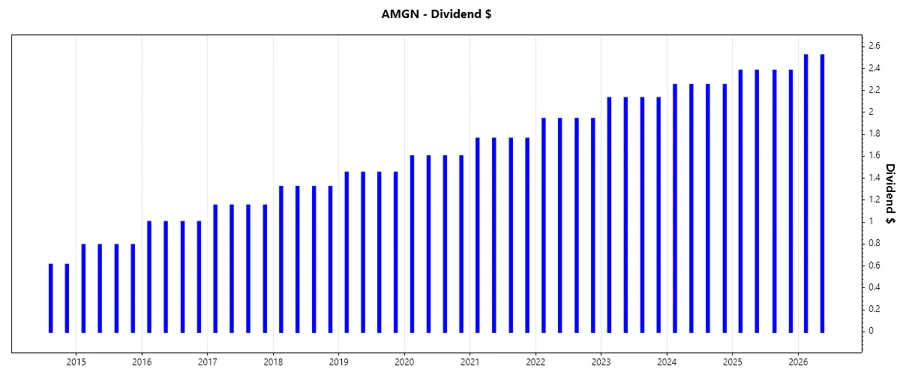
🗣️ Dividend History
The dividend history of Amgen Inc. portrays a consistent payout trajectory, essential for investors seeking reliability and income sustainability. This consistent dividend policy enhances investor confidence and reflects financial stability.
| Year | Dividend Per Share (USD) |
|---|---|
| 2026 | 5.04 |
| 2025 | 9.52 |
| 2024 | 9.00 |
| 2023 | 8.52 |
| 2022 | 7.76 |
📈 Dividend Growth
Tracking the growth of dividends over time offers investors insight into a company's ability to increase payouts even amid economic challenges. Amgen's dividend growth over both 3 and 5-year periods suggests a moderately upward trend.
| Time | Growth |
|---|---|
| 3 years | 7.05% |
| 5 years | 8.27% |
The average dividend growth is 8.27% over 5 years. This shows moderate but steady dividend growth.
✅ Payout Ratio
The payout ratio is a critical indicator of dividend sustainability. High ratios can indicate potential future reductions, while moderate ratios suggest sound dividend policies. Amgen’s EPS-based payout ratio of 65.94% juxtaposed against an FCF-based ratio of 59.79% illustrates a balanced distribution strategy.
| Key Figure | Ratio |
|---|---|
| EPS-based | 65.94% |
| Free Cash Flow-based | 59.79% |
While the payout ratio based on EPS suggests a healthy margin for maintaining dividend payments, the FCF ratio reiterates a slightly conservative but prudent approach, ensuring financial stability.
📊 Cashflow & Capital Efficiency
Cash flow analysis is crucial for determining a company's ability to sustain dividends and reinvest in its operations. Factors such as free cash flow yield, earnings yield, and CAPEX influence capital efficiency and future growth potential.
| Year | 2025 | 2024 | 2023 |
|---|---|---|---|
| Free Cash Flow Yield | 4.60% | 7.37% | 4.78% |
| Earnings Yield | 4.38% | 2.90% | 4.36% |
| CAPEX to Operating Cash Flow | 20.07% | 9.54% | 13.13% |
| Stock-based Compensation to Revenue | 0% | 1.59% | 1.53% |
| Free Cash Flow / Operating Cash Flow Ratio | 81.34% | 90.46% | 86.87% |
The analysis indicates solid cash flow stability and effective capital allocation strategies, suggesting Amgen's ability to sustain growth and return value to shareholders effectively.
📉 Balance Sheet & Leverage Analysis
Leverage metrics are pivotal in assessing the financial robustness of a company. Amgen's leverage ratios hint at a leveraged balance sheet, yet managed efficiently through its earnings capacity.
| Year | 2025 | 2024 | 2023 |
|---|---|---|---|
| Debt-to-Equity | 6.31 | 10.23 | 10.37 |
| Debt-to-Assets | 0.60 | 0.65 | 0.67 |
| Debt-to-Capital | 0.86 | 0.91 | 0.91 |
| Net Debt to EBITDA | 2.87 | 3.60 | 3.63 |
| Current Ratio | 1.14 | 1.26 | 1.65 |
| Quick Ratio | 0.89 | 0.95 | 1.13 |
| Financial Leverage | 10.46 | 15.63 | 15.59 |
The company's debt load is noteworthy, albeit supported by effective cash flow generation and investment strategies, attesting to financial endurance and calculated risk management.
📈 Fundamental Strength & Profitability
Profitability metrics such as return on equity and return on assets are fundamental indicators of a company's operational efficiency and financial performance.
| Year | 2025 | 2024 | 2023 |
|---|---|---|---|
| Return on Equity | 89.06% | 69.59% | 107.78% |
| Return on Assets | 8.51% | 4.45% | 6.91% |
| Margins: Net | 20.99% | 12.24% | 23.83% |
| EBIT | 29.06% | 23.23% | 38.06% |
| EBITDA | 43.12% | 39.96% | 52.50% |
| Gross | 70.80% | 61.53% | 70.15% |
| R&D to Revenue | 20.18% | 17.84% | 16.97% |
These figures showcase Amgen's strong profitability and operational efficiency, indicative of strategic financial management and innovation investment.
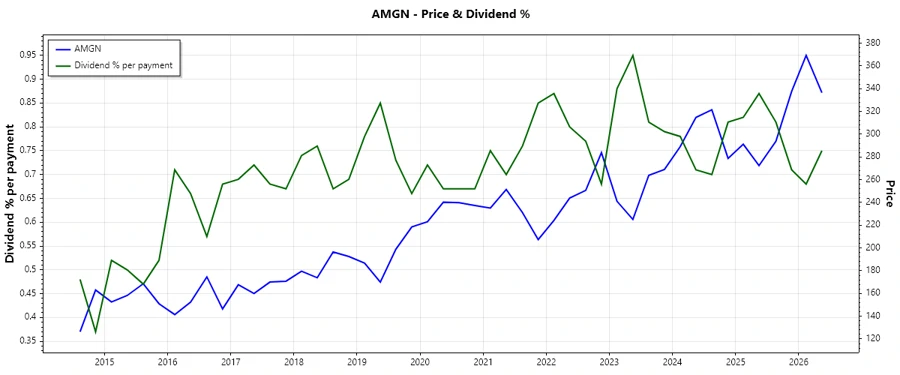
📊 Price Development
📊 Dividend Scoring System
| Criteria | Score | Score Bar |
|---|---|---|
| Dividend Yield | 4 | |
| Dividend Stability | 5 | |
| Dividend Growth | 4 | |
| Payout Ratio | 3 | |
| Financial Stability | 3 | |
| Dividend Continuity | 5 | |
| Cashflow Coverage | 4 | |
| Balance Sheet Quality | 2 |
Total Score: 30 / 40
📢 Rating
The analysis of Amgen Inc.'s dividend profile exhibits a strong and consistent payout history, backed by moderate growth and robust financial strategies. While some leverage concerns exist, the company remains a reliable choice for dividend-focused investors. Overall, Amgen is recommended as a solid long-term investment, with opportunities for capital appreciation aligned with dividend yield.
Smart Data Insight
Master the Perfect Entry & Exit for this Stock
Don't leave your profits to chance. Historically, this stock follows specific seasonal patterns that institutional traders use to maximize returns.
- ✅ Identify the "Golden Buying Window"
- ✅ Avoid high-risk correction cycles
- ✅ Backtested data from the last 20+ years