
April 21, 2026 a 12:46 pm

AMGN: Dividend Analysis - Amgen Inc.
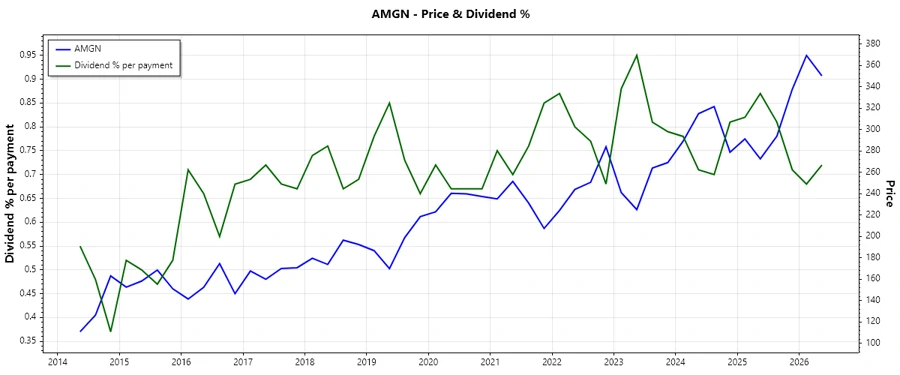
Amgen Inc., a leader in the biotechnology sector, has demonstrated a robust dividend-paying capacity over 16 years. The company's stable history of dividend payments is indicative of its financial health and commitment to shareholder returns. With a current market cap of approximately $189 billion, Amgen maintains a dividend yield of 2.12%, suggesting a steady income stream for investors. Yet, investors should consider the balance between growth prospects and payout ratios to ensure long-term dividend sustainability.
📊 Overview
Amgen operates within the biotechnology sector and displays a consistent dividend history over the past 16 years. With a dividend yield of 2.12% and no recent instances of cuts or suspensions, Amgen's dividend per share currently stands at $9.52 USD.
| Parameter | Details |
|---|---|
| Sector | Biotechnology |
| Dividend yield | 2.12 % |
| Current dividend per share | 9.52 USD |
| Dividend history | 16 years |
| Last cut or suspension | None |
🗣️ Dividend History
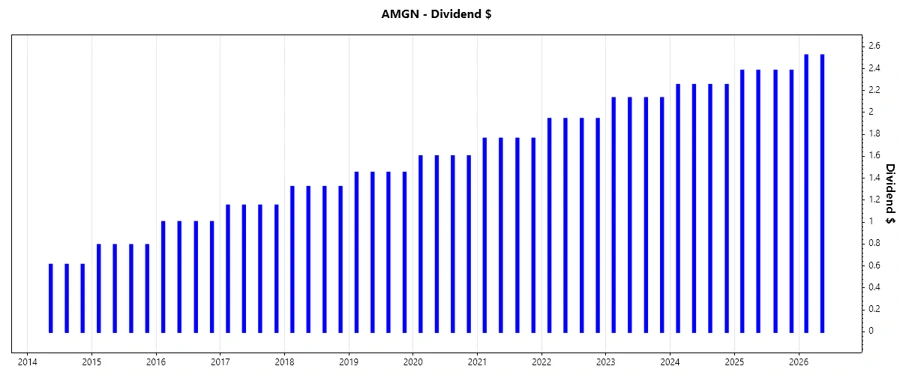
Amgen's dividend history is vital in reflecting its commitment to returning value to shareholders. The consistent dividend payments underscore the company's reliable cash flow and earnings capacity. This track record is particularly important for income-focused investors. Below is a summary of the last five dividend payments:
| Year | Dividend per Share |
|---|---|
| 2026 | 5.04 USD |
| 2025 | 9.52 USD |
| 2024 | 9.00 USD |
| 2023 | 8.52 USD |
| 2022 | 7.76 USD |
📈 Dividend Growth
Dividend growth is a measure of how much a dividend has increased over a specified period, reflecting the company's growing financial health. Amgen has managed an average dividend growth of 8.27% over the past five years, indicating a moderate yet steady increase.
| Time | Growth |
|---|---|
| 3 years | 7.05 % |
| 5 years | 8.27 % |
The average dividend growth is 8.27% over 5 years. This shows moderate but steady dividend growth.
📉 Payout Ratio
The payout ratio is a crucial metric to assess the sustainability of a company's dividend. It compares the dividends paid out to shareholders relative to the company's net income. Amgen's EPS-based payout ratio is 66.57%, while the free cash flow-based payout is 63.38%. Both figures suggest a healthy but closely monitored payout strategy to ensure dividend sustainability without compromising growth potential.
| Key figure | Ratio |
|---|---|
| EPS-based | 66.57 % |
| Free cash flow-based | 63.38 % |
With an EPS payout ratio of 66.57%, Amgen is allocating a substantial portion of its earnings to dividends. This level is balanced and indicates that the company is able to maintain its dividend payments while still investing in business growth.
✅ Cashflow & Capital Efficiency
Understanding Amgen’s cash flow generation and capital efficiency is imperative to assessing its ability to sustain and grow dividend payouts. The metrics point towards how effectively the company manages its capital and generates free cash, which in turn supports its dividend policy.
| Year | 2025 | 2024 | 2023 |
|---|---|---|---|
| Free Cash Flow Yield | 4.60 % | 7.37 % | 4.78 % |
| Earnings Yield | 4.38 % | 2.90 % | 4.36 % |
| CAPEX to Operating Cash Flow | 18.66 % | 9.54 % | 13.13 % |
| Stock-based Compensation to Revenue | 0 % | 1.59 % | 1.53 % |
| Free Cash Flow / Operating Cash Flow Ratio | 81.34 % | 90.46 % | 86.87 % |
The data highlights Amgen's effective capital management, with a focus on maintaining healthy cash flow ratios. This enables consistent dividend payouts alongside investments in the business for growth.
⚠️ Balance Sheet & Leverage Analysis
Analyzing Amgen’s balance sheet provides insights into its financial health, indicating how well the company can manage its debts and sustain financial operations. Observing key metrics such as the debt-to-equity ratio and current ratio illustrates Amgen's financial stability and liquidity position.
| Year | 2025 | 2024 | 2023 |
|---|---|---|---|
| Debt-to-Equity | 6.31 | 10.23 | 10.37 |
| Debt-to-Assets | 0.60 | 0.65 | 0.67 |
| Debt-to-Capital | 0.86 | 0.91 | 0.91 |
| Net Debt to EBITDA | 2.87 | 3.60 | 3.63 |
| Current Ratio | 1.14 | 0 | 1.65 |
| Quick Ratio | 0.90 | 0.95 | 1.13 |
| Financial Leverage | 10.46 | 15.63 | 15.59 |
Amgen displays a relatively high leverage ratio which indicates that the company has substantial debt; however, it has a reasonable quick ratio that suggests its ability to cover short-term obligations with its most liquid assets.
🔍 Fundamental Strength & Profitability
Evaluating the fundamental strength and profitability of Amgen is essential for understanding its long-term growth potential and operational efficiency. Metrics such as return on equity and profit margins provide insight into how effectively the company generates returns on its investments.
| Year | 2025 | 2024 | 2023 |
|---|---|---|---|
| Return on Equity | 89.06 % | 69.59 % | 107.78 % |
| Return on Assets | 8.51 % | 4.45 % | 6.91 % |
| Net Profit Margin | 20.99 % | 12.24 % | 23.83 % |
| EBIT Margin | 29.06 % | 23.23 % | 38.06 % |
| EBITDA Margin | 43.12 % | 39.96 % | 52.50 % |
| Gross Margin | 70.80 % | 61.53 % | 70.15 % |
| R&D to Revenue | 19.88 % | 17.84 % | 16.97 % |
Amgen's impressive return on equity, alongside significant profit margins, indicate a strong and profitable business, sustaining its growth trajectory and dividend commitments through operational efficiency.
📉 Price Development
📈 Dividend Scoring System
The following table provides an individual scoring of Amgen's dividend aspects based on key performance indicators across the investment spectrum.
| Category | Score | Score Bar |
|---|---|---|
| Dividend yield | 3/5 | |
| Dividend Stability | 4/5 | |
| Dividend growth | 3/5 | |
| Payout ratio | 3/5 | |
| Financial stability | 2/5 | |
| Dividend continuity | 4/5 | |
| Cashflow Coverage | 3/5 | |
| Balance Sheet Quality | 3/5 |
Total Score: 25/40
🗣️ Rating
Amgen presents a compelling blend of robust dividend history and growth potential for investors, with slight challenges in financial leverage and cash flow coverage. The total score of 25/40 in the dividend scoring system suggests a stable dividend play but warrants careful consideration of debt levels and dividend sustainability in light of potential economic shifts.
Smart Data Insight
Master the Perfect Entry & Exit for this Stock
Don't leave your profits to chance. Historically, this stock follows specific seasonal patterns that institutional traders use to maximize returns.
- ✅ Identify the "Golden Buying Window"
- ✅ Avoid high-risk correction cycles
- ✅ Backtested data from the last 20+ years