March 05, 2026 a 12:46 pm


AMGN: Dividend Analysis - Amgen Inc.
Amgen Inc. presents a compelling dividend profile with a current yield of 2.62% and a consistent dividend history of 16 years. Despite a moderate growth rate, the stability and continuity in dividend payments are commendable, reflecting the company’s solid standing in the biotechnology sector. Investors seeking steady income through dividends may find Amgen an attractive option.
📊 Overview
Amgen Inc., a major player in the biotechnology sector, commands a significant market presence with its robust dividend yield.
| Metric | Value |
|---|---|
| Sector | Biotechnology |
| Dividend Yield | 2.62% |
| Current Dividend Per Share | 9.52 USD |
| Dividend History | 16 years |
| Last Cut or Suspension | None |
🗣️ Dividend History
Amgen’s dividend history exemplifies a policy of consistency and reliability. This history is crucial for retirees and income-focused investors looking for predictability in payouts.
| Year | Dividend Per Share (USD) |
|---|---|
| 2026 | 2.52 |
| 2025 | 9.52 |
| 2024 | 9.00 |
| 2023 | 8.52 |
| 2022 | 7.76 |
📈 Dividend Growth
The growth in dividends over recent years reflects the company’s commitment to increasing shareholder value through rising distributing percentages. This is vital for investors who prefer a growth-oriented dividend strategy.
| Time | Growth |
|---|---|
| 3 years | 7.05% |
| 5 years | 8.27% |
The average dividend growth is 8.27% over 5 years. This shows moderate but steady dividend growth.
🗣️ Payout Ratio
Payout ratios are crucial as they indicate the proportion of earnings and cash flow being utilized to pay dividends, impacting sustainability.
| Key Figure Ratio | Value |
|---|---|
| EPS-based | 66.57% |
| Free Cash Flow-based | 63.38% |
The EPS-based payout ratio of 66.57% and FCF-based payout ratio of 63.38% suggest a balanced approach to dividend payments while maintaining sufficient reinvestment in business growth.
🗣️ Cashflow & Capital Efficiency
Understanding cash flow dynamics and capital efficiency is instrumental for assessing the company’s ability to generate sustainable cash to cover dividends and measure overall operational efficiency.
| Year | 2025 | 2024 | 2023 |
|---|---|---|---|
| Free Cash Flow Yield | 4.60% | 7.37% | 4.78% |
| Earnings Yield | 4.38% | 2.90% | 4.36% |
| CAPEX to Operating Cash Flow | 18.66% | 9.54% | 13.13% |
| Stock Compensation to Revenue | 0% | 1.59% | 1.53% |
| Free Cash Flow / Operating Cash Flow Ratio | 81.34% | 90.46% | 86.87% |
A strong free cash flow yield, in conjunction with a balanced CAPEX, reflects efficient capital utilization and financial robustness in return generation.
🗣️ Balance Sheet & Leverage Analysis
The company’s balance sheet metrics are pivotal in understanding financial leverage and ensuring sufficient liquidity and low dependence on debt financing.
| Year | 2025 | 2024 | 2023 |
|---|---|---|---|
| Debt-to-Equity | 6.31 | 10.23 | 10.37 |
| Debt-to-Assets | 60.28% | 65.44% | 66.51% |
| Debt-to-Capital | 86.31% | 91.09% | 91.20% |
| Net Debt to EBITDA | 2.87 | 3.60 | 3.63 |
| Current Ratio | 1.14 | 1.26 | 1.65 |
| Quick Ratio | 0.9 | 0.95 | 1.13 |
| Financial Leverage | 10.46 | 15.63 | 15.59 |
The leverage metrics indicate a robust capital base, though the high debt-to-equity ratio signals potential risks which require careful monitoring.
🗣️ Fundamental Strength & Profitability
Profitability metrics allow investors to evaluate the company's effectiveness in employing its resources and generating returns in excess of its costs of capital.
| Year | 2025 | 2024 | 2023 |
|---|---|---|---|
| Return on Equity | 89.06% | 69.59% | 107.78% |
| Return on Assets | 8.51% | 4.45% | 6.91% |
| Margins - Net | 20.99% | 12.24% | 23.83% |
| Margins - EBIT | 29.06% | 23.23% | 38.06% |
| Margins - EBITDA | 43.12% | 39.96% | 52.50% |
| Margins - Gross | 70.80% | 61.53% | 70.15% |
| Research & Development to Revenue | 18.98% | 17.84% | 16.97% |
The company’s high return on equity and respectable gross margins demonstrate its proficient operational management and ability to adjust dynamically to industry exigencies.
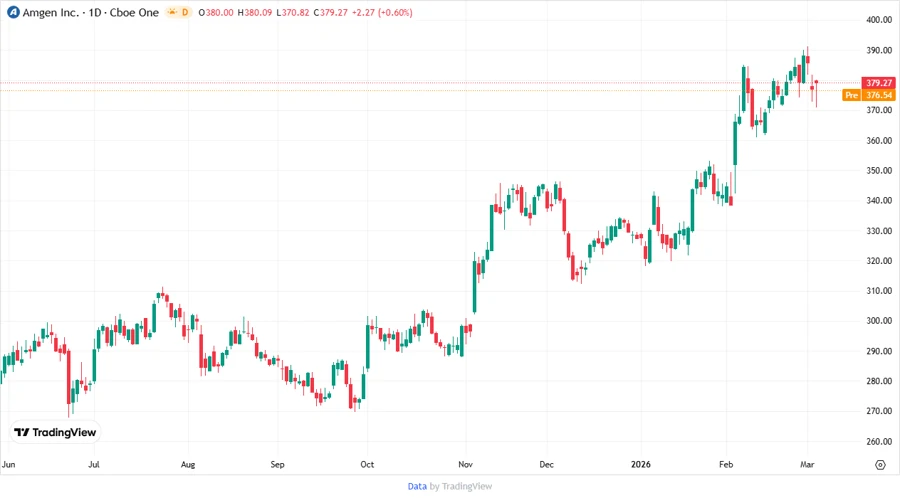
Price Development
✅ Dividend Scoring System
| Category | Score | Indicator |
|---|---|---|
| Dividend Yield | 4 | |
| Dividend Stability | 5 | |
| Dividend Growth | 3 | |
| Payout Ratio | 4 | |
| Financial Stability | 3 | |
| Dividend Continuity | 5 | |
| Cashflow Coverage | 4 | |
| Balance Sheet Quality | 3 |
Total Score: 31/40
⚠️ Rating
Amgen Inc. showcases a strong dividend payout history with stable growth trends and a robust financial framework. While the high leverage ratios warrant vigilance, the overall financial health and performance make it a solid prospect for dividend-focused investors seeking a mature and reliable income stream. Consider monitoring debt metrics and broader market trends to fully capitalize on investment opportunities.
Smart Data Insight
Master the Perfect Entry & Exit for this Stock
Don't leave your profits to chance. Historically, this stock follows specific seasonal patterns that institutional traders use to maximize returns.
- ✅ Identify the "Golden Buying Window"
- ✅ Avoid high-risk correction cycles
- ✅ Backtested data from the last 20+ years