December 27, 2025 a 07:30 am

AMGN: Dividend Analysis - Amgen Inc.
Amgen Inc. presents a compelling dividend profile with a consistent history of payouts. With a dividend yield of 2.90% and a stable payout ratio, Amgen appears to sustain investor interest through moderate yet steady dividend growth. Historical patterns of dividend payments, devoid of significant cuts until future projections, enhance the company's prospect as a dividend-paying entity.
📊 Overview
| Metric | Value |
|---|---|
| Sector | Healthcare |
| Dividend Yield | 2.90 % |
| Current Dividend per Share | 8.93 USD |
| Dividend History | 16 years |
| Last Cut or Suspension | 2026 |
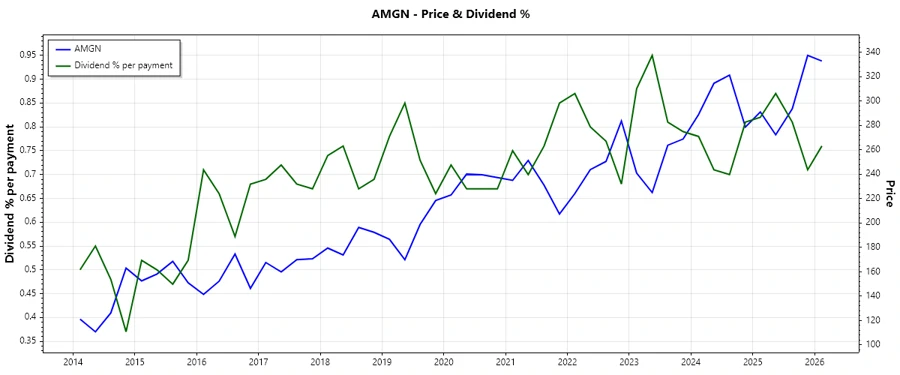
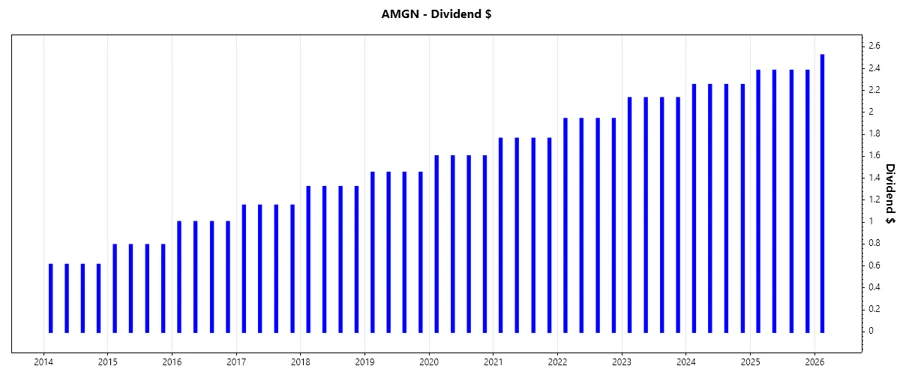
🗣️ Dividend History
Amgen has recorded 16 years of consecutive dividend payments. This consistent payout history underscores Amgen's commitment to returning value to shareholders, which is a positive indicator for potential and existing investors looking for income stability.
| Year | Dividend per Share (USD) |
|---|---|
| 2026 | 2.52 |
| 2025 | 9.52 |
| 2024 | 9.00 |
| 2023 | 8.52 |
| 2022 | 7.76 |
📈 Dividend Growth
The historical dividend growth rates over the past years reflect Amgen's ability to gradually enhance shareholder returns. Such growth is vital for preserving purchasing power against inflation.
| Time | Growth |
|---|---|
| 3 years | 8.53 % |
| 5 years | 9.18 % |
The average dividend growth is 9.18 % over 5 years. This shows moderate but steady dividend growth.
💼 Payout Ratio
Payout ratios provide insights into the sustainability of a company's dividend payments relative to its earnings and cash flows. This highlights how much of its earnings Amgen reinvests or retains as buffer.
| Key figure | Ratio |
|---|---|
| EPS-based | 68.60 % |
| Free cash flow-based | 41.68 % |
The EPS payout ratio of 68.60 % indicates a substantial portion of earnings are paid out as dividends, whereas the FCF payout ratio of 41.68 % suggests ample cash flow coverage, enhancing dividend security.
💲 Cashflow & Capital Efficiency
Amgen's cash flow metrics, coupled with its capital efficiency, are critical for assessing its ability to sustain operations and derive optimal returns on invested capital.
| 2024 | 2023 | 2022 | |
|---|---|---|---|
| Free Cash Flow Yield | 7.37 % | 4.78 % | 6.22 % |
| Earnings Yield | 2.90 % | 4.36 % | 4.64 % |
| CAPEX/Ops Cash Flow | 0.095 | 0.131 | 0.096 |
| Stock-based Comp/Reven | 0.016 | 0.015 | 0.015 |
| FCF/Operating CF Ratio | 0.905 | 0.869 | 0.904 |
Stable free cash flow indicators relative to operating cash flow ratios signal robust internal cash generation, supporting dividends without impairing strategic investments.
📂 Balance Sheet & Leverage Analysis
Understanding Amgen's balance sheet dynamics aids in evaluating its financial resilience and risk regarding leverage and liquidity positions.
| 2024 | 2023 | 2022 | |
|---|---|---|---|
| Debt-to-Equity | 10.36 | 10.37 | 10.64 |
| Debt-to-Assets | 0.663 | 0.665 | 0.598 |
| Debt-to-Capital | 0.912 | 0.912 | 0.914 |
| Net Debt/EBITDA | 3.662 | 3.626 | 2.573 |
| Current Ratio | 0.00 | 1.649 | 1.414 |
| Quick Ratio | 0.954 | 1.132 | 1.100 |
| Financial Leverage | 15.63 | 15.59 | 17.79 |
Amgen maintains high leverage ratios, indicating reliance on debt but supported by adequate liquidity through available cash and equivalents.
💪 Fundamental Strength & Profitability
Profitability measures reveal Amgen's operational effectiveness, highlighting its ability to convert revenues into profit and sustain competitive advantage.
| 2024 | 2023 | 2022 | |
|---|---|---|---|
| Return on Equity | 69.59 % | 107.78 % | 178.97 % |
| Return on Assets | 4.45 % | 6.91 % | 10.06 % |
| Return on Invested Capital | 8.90 % | 8.41 % | 16.67 % |
| Net Margin | 12.24 % | 23.83 % | 24.89 % |
| EBIT Margin | 23.23 % | 38.06 % | 33.25 % |
| EBITDA Margin | 39.96 % | 52.50 % | 46.23 % |
| Gross Margin | 61.53 % | 70.15 % | 75.66 % |
| R&D to Revenue | 19.06 % | 16.97 % | 16.84 % |
Amgen boasts strong profitability ratios with high margins across net, EBIT, and EBITDA categories, reflecting its competitive pricing and cost management strategies.
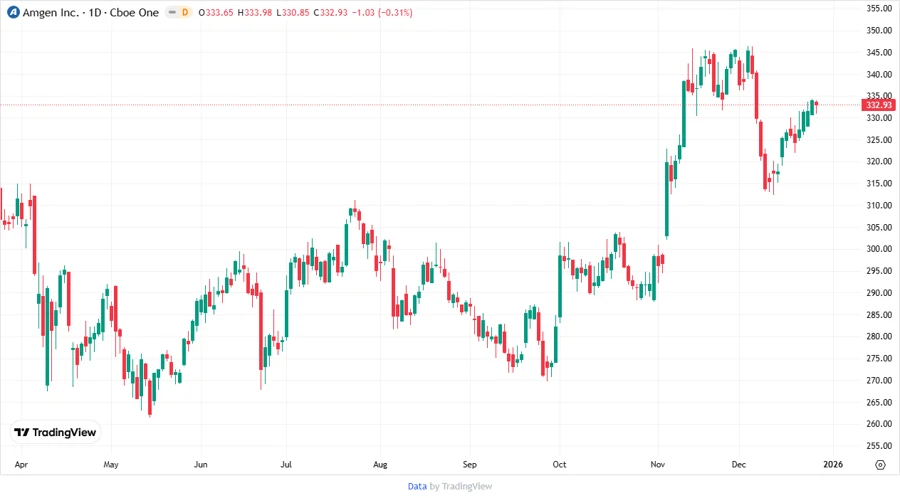
📉 Price Development
🔍 Dividend Scoring System
| Criteria | Score | Rating |
|---|---|---|
| Dividend Yield | 3 | |
| Dividend Stability | 4 | |
| Dividend Growth | 3 | |
| Payout Ratio | 4 | |
| Financial Stability | 3 | |
| Dividend Continuity | 4 | |
| Cashflow Coverage | 4 | |
| Balance Sheet Quality | 2 |
Total Score: 27/40
✅ Rating
Amgen Inc. shows a resilient commitment to dividend payouts and exhibits a robust growth trajectory. While maintaining strong financial ratios, the company provides a favorable position for income-focused investors. However, investors should remain vigilant about leverage levels and future industry developments. Overall, Amgen earns a solid buy recommendation for dividend-seeking portfolios.