December 12, 2025 a 03:31 am


AMGN: Dividend Analysis - Amgen Inc.
Amgen Inc., a global biotechnology giant, represents a compelling proposition for dividend investors. With a robust dividend history and consistent payout growth over the years, it stands as a strong choice for those seeking stable income. Despite its complex financial framework, the company exhibits a commendable balance between dividend sustainability and growth potential, catering to long-term investors.
Overview 📊
As a prominent player in the biotechnology sector, Amgen boasts a remarkable dividend yield of 2.82%, supporting its solid income-generating reputation. Over an impressive 15-year dividend history, the company has shown consistent dividend payments, with no recent cuts or suspensions, reflecting a stable financial stance.
| Metric | Value |
|---|---|
| Sector | Biotechnology |
| Dividend yield | 2.82% |
| Current dividend per share | 8.93 USD |
| Dividend history | 15 years |
| Last cut or suspension | None |
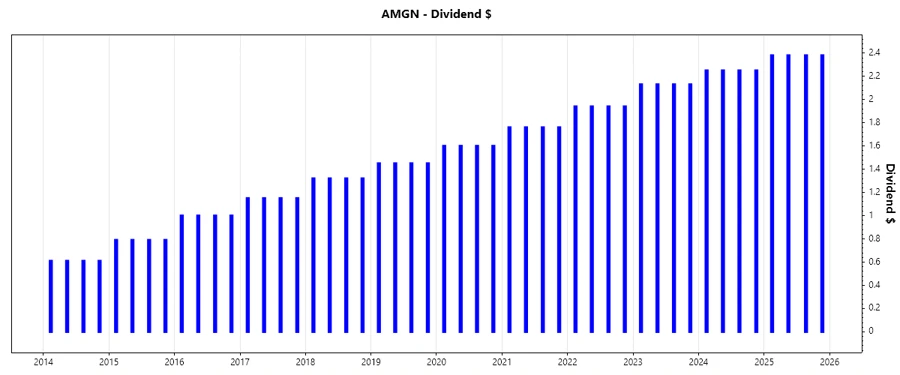
Dividend History 🗣️
The significance of a consistent dividend history cannot be overstated, signaling financial stability and investor trust. Amgen's strong history over the last decade puts it in an advantageous position among dividend payers.
| Year | Dividend Per Share (USD) |
|---|---|
| 2025 | 9.52 |
| 2024 | 9.00 |
| 2023 | 8.52 |
| 2022 | 7.76 |
| 2021 | 7.04 |
Dividend Growth 📈
Amgen's dividend growth metrics highlight attractive income dynamics, demonstrating consistent increases over the past years and affirming its commitment to rewarding shareholders.
| Time | Growth |
|---|---|
| 3 years | 8.53% |
| 5 years | 9.18% |
The average dividend growth is 9.18% over 5 years. This shows moderate but steady dividend growth.
Payout Ratio ✔️
An essential aspect of dividend analysis, the payout ratio gauges a company's ability to maintain its dividend payments. With EPS-based ratio at 68.60% and Free Cash Flow-based ratio at 41.68%, Amgen demonstrates a balanced approach to ensuring dividend sustainability without compromising growth.
| Key figure | Ratio |
|---|---|
| EPS-based | 68.60% |
| Free Cash Flow-based | 41.68% |
The figures suggest a prudent approach towards capital allocation, ensuring adequate buffer against economic fluctuations while maintaining investor confidence through reliable dividends.
Cashflow & Capital Efficiency 💼
Examining cash flow and capital efficiency reveals pivotal insights into financial health and strategic capital allocation. Amgen's dynamics in these areas present a scenario of sound resource management, pivotal for long-term sustainability and growth.
| Year | 2024 | 2023 | 2022 |
|---|---|---|---|
| Free Cash Flow Yield | 7.37% | 4.78% | 6.22% |
| Earnings Yield | 2.90% | 4.36% | 4.64% |
| CAPEX to Operating Cash Flow | 9.54% | 13.13% | 9.63% |
| Stock-based Compensation to Revenue | 1.59% | 1.53% | 1.52% |
| Free Cash Flow / Operating Cash Flow Ratio | 90.46% | 86.87% | 90.37% |
The analysis reflects robust cash generation and efficient capital deployment, contributing to Amgen's durability in returning capital to shareholders under varied economic conditions.
Balance Sheet & Leverage Analysis 🏦
An examination of leverage ratios underscores Amgen's adept management of debt and equity relations, crucial for upholding financial solidity and operational resilience.
| Year | 2024 | 2023 | 2022 |
|---|---|---|---|
| Debt-to-Equity | 10.36 | 10.37 | 10.64 |
| Debt-to-Assets | 0.66 | 0.67 | 0.60 |
| Debt-to-Capital | 0.91 | 0.91 | 0.91 |
| Net Debt to EBITDA | 3.66 | 3.63 | 2.57 |
| Current Ratio | 1.28 | 1.65 | 1.41 |
| Quick Ratio | 0.95 | 1.13 | 1.10 |
| Financial Leverage | 15.63 | 15.59 | 17.79 |
With manageable leverage levels and ample liquidity, Amgen maintains a commendable portion of its assets free from encumbrances, facilitating adaptability to market demands.
Fundamental Strength & Profitability 🔍
Evaluating fundamental strengths such as profitability ratios underscores Amgen's competencies in carving competitive advantages and sustaining shareholder value creation.
| Year | 2024 | 2023 | 2022 |
|---|---|---|---|
| Return on Equity | 69.59% | 107.78% | 178.97% |
| Return on Assets | 4.45% | 6.91% | 10.06% |
| Margins: Net | 12.24% | 23.83% | 24.89% |
| EBIT | 23.23% | 38.06% | 33.25% |
| EBITDA | 39.96% | 52.50% | 46.23% |
| Gross | 61.53% | 70.15% | 75.66% |
| Research & Development to Revenue | 19.06% | 16.97% | 16.84% |
The company continues to sustain superior profit levels and efficient cost management, signaling resilience even across challenging industry dynamics.
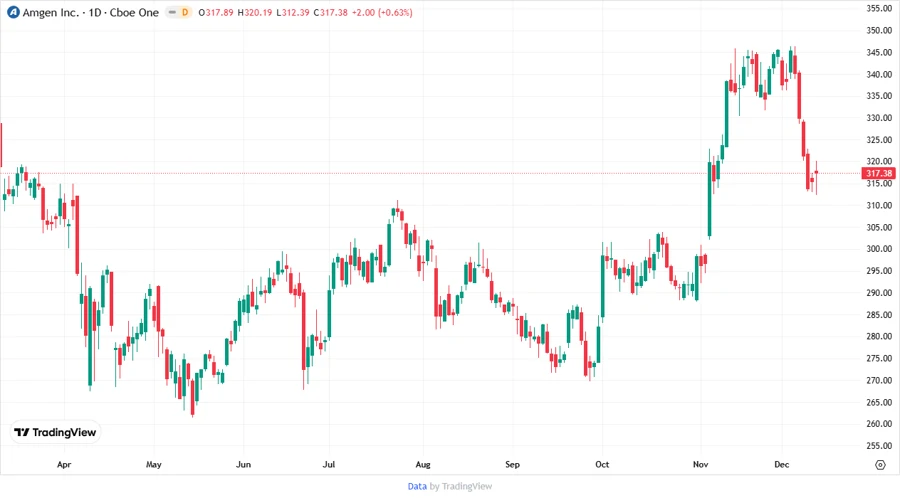
Price Development 📉
Dividend Scoring System ✅
| Factor | Score (1-5) | Indicator |
|---|---|---|
| Dividend yield | 4 | |
| Dividend Stability | 5 | |
| Dividend growth | 4 | |
| Payout ratio | 3 | |
| Financial stability | 3 | |
| Dividend continuity | 5 | |
| Cashflow Coverage | 4 | |
| Balance Sheet Quality | 3 |
Total Score: 31/40
Rating ⭐
The analysis indicates that Amgen Inc. is a robust dividend-paying entity, meriting consideration for portfolios focused on reliable income streams. Its solid financial framework and equitable growth contribute to a favorable investment outlook.
Smart Data Insight
Master the Perfect Entry & Exit for this Stock
Don't leave your profits to chance. Historically, this stock follows specific seasonal patterns that institutional traders use to maximize returns.
- ✅ Identify the "Golden Buying Window"
- ✅ Avoid high-risk correction cycles
- ✅ Backtested data from the last 20+ years