November 26, 2025 a 02:46 am


AMGN: Dividend Analysis - Amgen Inc.
Amgen Inc. presents a robust dividend profile characterized by stable dividend growth and a solid commitment to shareholder returns. With a 15-year history of consistent dividend payments and a commendable yield of 2.82%, Amgen remains a strong contender for income-focused investors. However, investors should remain cognizant of its relatively high payout ratios.
Overview 📊
Amgen Inc., operating in the biotechnology sector, demonstrates a reliable history of dividend payments with a current dividend yield of 2.82%. This yield is supported by a current dividend per share of $8.93, spanning an impressive 15-year unbroken history of dividend growth. The absence of any recent dividend cuts further bolsters its appeal.
| Metric | Value |
|---|---|
| Sector | Biotechnology |
| Dividend Yield | 2.82% |
| Current Dividend Per Share | $8.93 USD |
| Dividend History | 15 years |
| Last Cut or Suspension | None |
Dividend History 🗣️
Understanding the dividend history is crucial as it provides insights into Amgen's commitment to returning capital to shareholders. A track record of consistent payments signals reliability and financial stability.
| Year | Dividend Per Share (USD) |
|---|---|
| 2025 | 9.52 |
| 2024 | 9.00 |
| 2023 | 8.52 |
| 2022 | 7.76 |
| 2021 | 7.04 |
Dividend Growth 📈
The growth of dividends over time signals the company's strength in increasing shareholder value. With a growth rate of 8.53% over the past three years and 9.18% over the past five years, Amgen showcases steady appreciation in dividends.
| Time | Growth (%) |
|---|---|
| 3 years | 8.53% |
| 5 years | 9.18% |
The average dividend growth is 9.18% over 5 years. This shows moderate but steady dividend growth.
Payout Ratio ⚠️
The payout ratio is a key indicator of dividend sustainability. A manageable payout ratio suggests that the company is likely generating sufficient earnings to cover dividends, mitigating the risk of payout cuts.
| Key figure ratio | Value |
|---|---|
| EPS-based | 68.60% |
| Free cash flow-based | 41.68% |
The EPS payout ratio of 68.60% is relatively high, suggesting that a significant portion of earnings is dedicated to dividends, whereas the FCF-based ratio of 41.68% reflects efficient cash flow utilization.
Cashflow & Capital Efficiency 💰
This section highlights the efficiency with which Amgen converts revenue into cash flow while managing capital expenditure, crucial for sustaining dividends and growth.
| Metric | 2024 | 2023 | 2022 |
|---|---|---|---|
| Free Cash Flow Yield | 7.37% | 4.78% | 6.22% |
| Earnings Yield | 2.90% | 4.36% | 4.64% |
| CAPEX to Operating Cash Flow | 9.54% | 13.13% | 9.63% |
| Stock-based Compensation to Revenue | 1.59% | 1.53% | 1.52% |
| Free Cash Flow / Operating Cash Flow Ratio | 0.90 | 0.87 | 0.90 |
Amgen's cash flow stability and capital efficiency are highlighted by its robust free cash flow yield and responsible investment in CAPEX. These metrics underscore the company’s capacity to internally finance its growth while sustaining dividends.
Balance Sheet & Leverage Analysis 📉
Amgen's balance sheet analysis provides insight into its financial leverage and ability to cover liabilities. A strong balance sheet supports dividend continuity and financial resilience.
| Metric | 2024 | 2023 | 2022 |
|---|---|---|---|
| Debt-to-Equity | 10.36 | 10.37 | 10.64 |
| Debt-to-Assets | 66.29% | 66.51% | 59.80% |
| Debt-to-Capital | 91.20% | 91.20% | 91.40% |
| Net Debt to EBITDA | 3.67 | 3.63 | 2.57 |
| Current Ratio | 0 | 1.65 | 1.41 |
| Quick Ratio | 0.95 | 1.13 | 1.10 |
| Financial Leverage | 15.63 | 15.59 | 17.79 |
Amgen's leverage ratios indicate a high level of financial obligation; however, its ability to cover interest and maintain liquidity provides some cushion, ensuring ongoing operational and growth potential.
Fundamental Strength & Profitability ✅
Key profitability ratios such as return on equity and margins offer insights into operational efficiency and long-term viability. Strong returns highlight management's effectiveness.
| Metric | 2024 | 2023 | 2022 |
|---|---|---|---|
| Return on Equity | 69.59% | 107.78% | 178.97% |
| Return on Assets | 4.45% | 6.91% | 10.06% |
| Margins: Net | 12.24% | 23.83% | 24.89% |
| EBIT | 23.23% | 38.06% | 33.25% |
| EBITDA | 39.96% | 52.50% | 46.23% |
| Gross | 61.53% | 70.15% | 75.66% |
| Research & Development to Revenue | 17.84% | 16.97% | 16.84% |
Amgen's profitability metrics place it in a strong position within the sector, enabling resilience against market volatility and fostering continued growth in dividends.
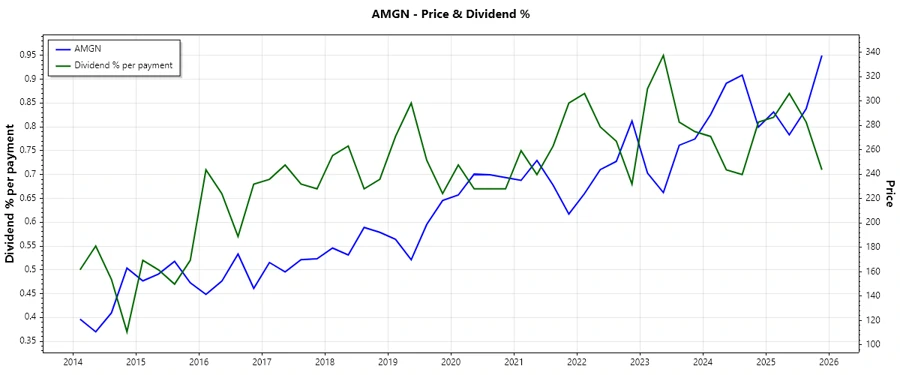
Price Development 📈
Dividend Scoring System ⚖️
| Category | Score out of 5 | Score Bar |
|---|---|---|
| Dividend Yield | 3 | |
| Dividend Stability | 4 | |
| Dividend Growth | 4 | |
| Payout Ratio | 2 | |
| Financial Stability | 4 | |
| Dividend Continuity | 5 | |
| Cashflow Coverage | 3 | |
| Balance Sheet Quality | 3 |
Total Score: 28 out of 40
Rating & Conclusion 🏆
Amgen Inc. offers a viable investment opportunity for dividend-focused investors, with its consistent dividend payments and credible growth trajectory. While the payout ratio indicates substantial profit allocation towards dividends, the company's financial foundation appears sound. Investors are advised to monitor specific economic environments that may impact cash flows but can generally view Amgen as a stable choice within the biotechnology sector.