October 11, 2025 a 12:46 pm


AMGN: Dividend Analysis - Amgen Inc.
Amgen Inc. presents an attractive dividend profile with a solid track record of 15 consecutive years of dividend payments. With a current yield of approximately 3.20%, this biotech giant provides stable and consistent income to investors. However, the high payout ratio warrants cautious optimism regarding future dividend sustainability. Let’s delve deeper into Amgen's dividend metrics and overall financial health.
Overview 📊
Amgen Inc., firmly situated within the biotechnology sector, provides investors with a notable dividend yield of 3.20% based on its current share price. This is complemented by a current dividend per share of $8.93, underpinning a robust commitment to return value to shareholders. Having maintained a 15-year history of uninterrupted dividend payments, this track record highlights Amgen's dedication to rewarding shareholders, despite the absence of recent dividend cuts or suspensions.
| Sector | Dividend Yield | Current Dividend Per Share | Dividend History | Last Cut or Suspension |
|---|---|---|---|---|
| Biotechnology | 3.20% | 8.93 USD | 15 years | None |
Dividend History 🗣️
Amgen's dividend history showcases progressive increases, vital for investors seeking reliable income growth. Over the last five years, the company has steadily raised its dividend, reflecting strong corporate health. Maintaining or increasing dividends communicates management’s confidence in Amgen's earning power and cash flow generation.
| Year | Dividend Per Share (USD) |
|---|---|
| 2025 | 7.14 |
| 2024 | 9.00 |
| 2023 | 8.52 |
| 2022 | 7.76 |
| 2021 | 7.04 |
Dividend Growth 📈
Over recent periods, Amgen has demonstrated a modest but notable dividend growth, underscoring a sustainable growth strategy. Consistent growth remains a crucial metric for investors prioritizing income reinvestment and inflation hedging.
| Time | Growth |
|---|---|
| 3 years | 8.53% |
| 5 years | 9.18% |
The average dividend growth is 9.18% over 5 years. This shows moderate but steady dividend growth.
Payout Ratio ⚠️
Amgen’s payout ratios reflect its dividend sustainability. The EPS-based payout ratio stands at approximately 72.60%, suggesting a commitment to maintaining dividend distributions despite substantial profit allocation. Additionally, with a Free Cash Flow (FCF) payout ratio near 45.34%, Amgen showcases disciplined financial management, ensuring cash flow sufficiency even after dividends.
| Key Figure | Ratio |
|---|---|
| EPS-based | 72.60% |
| Free Cash Flow-based | 45.34% |
The payout ratios indicate that Amgen is using a significant portion of its earnings and cash flow for dividend payments, but maintains a comfortable coverage through its cash-generated operations, which is prudent for future sustainability.
Cashflow & Capital Efficiency 💰
Amgen’s focus on cash flow generation and capital efficiency is underscored by key financial metrics, reflecting a well-balanced approach. Free Cash Flow yields and earnings yield emphasize solid cash flow management, promoting reinvestment opportunities and shareholder returns.
| Metric | 2024 | 2023 | 2022 |
|---|---|---|---|
| Free Cash Flow Yield | 7.37% | 4.78% | 6.22% |
| Earnings Yield | 2.90% | 4.36% | 4.64% |
| CAPEX to Operating Cash Flow | 9.54% | 13.13% | 9.63% |
| Stock-based compensation to Revenue | 1.58% | 1.53% | 1.52% |
| Free Cash Flow / Operating Cash Flow | 90.46% | 86.87% | 90.37% |
Amgen's consistent cash flow stability enhances its flexibility to fund operations, growth initiatives, and dividends – a testament to sound capital efficiency strategies.
Balance Sheet & Leverage Analysis 📉
Amgen's balance sheet demonstrates a leveraged profile, with particular emphasis on managing debt levels effectively. Reviewing key ratios such as Debt-to-Equity suggests cautious leverage utilization aimed at maximizing capital resource productivity, vital for creditworthiness and financial agility.
| Metric | 2024 | 2023 | 2022 |
|---|---|---|---|
| Debt-to-Equity | 10.23 | 10.37 | 10.64 |
| Debt-to-Assets | 0.65 | 0.67 | 0.60 |
| Debt-to-Capital | 0.91 | 0.91 | 0.91 |
| Net Debt to EBITDA | 3.60 | 3.63 | 2.57 |
| Current Ratio | 1.30 | 1.65 | 1.41 |
| Quick Ratio | 0.95 | 1.13 | 1.10 |
| Financial Leverage | 15.63 | 15.59 | 17.79 |
These metrics suggest a high level of leverage, potentially posing future liquidity risks. However, Amgen’s solid underlying earnings power provides confidence in managing its debt obligations.
Fundamental Strength & Profitability ✅
Amgen’s fundamental strength is emphasized by its strong profitability metrics, including competitive margins and efficient capital utilization. Notably, its substantial Return on Equity indicates effective shareholder value creation through strategic reinvestment and operational excellence.
| Metric | 2024 | 2023 | 2022 |
|---|---|---|---|
| Return on Equity | 69.59% | 107.78% | 178.97% |
| Return on Assets | 4.45% | 6.91% | 10.06% |
| Margins: Net | 12.24% | 23.83% | 24.89% |
| EBIT | 23.23% | 38.06% | 33.25% |
| EBITDA | 39.96% | 52.50% | 46.23% |
| Gross | 61.53% | 70.15% | 75.66% |
| Research & Development to Revenue | 18.35% | 16.97% | 16.84% |
These figures reinforce Amgen’s competitive advantage and capacity for enduring profitability, meeting shareholder expectations.
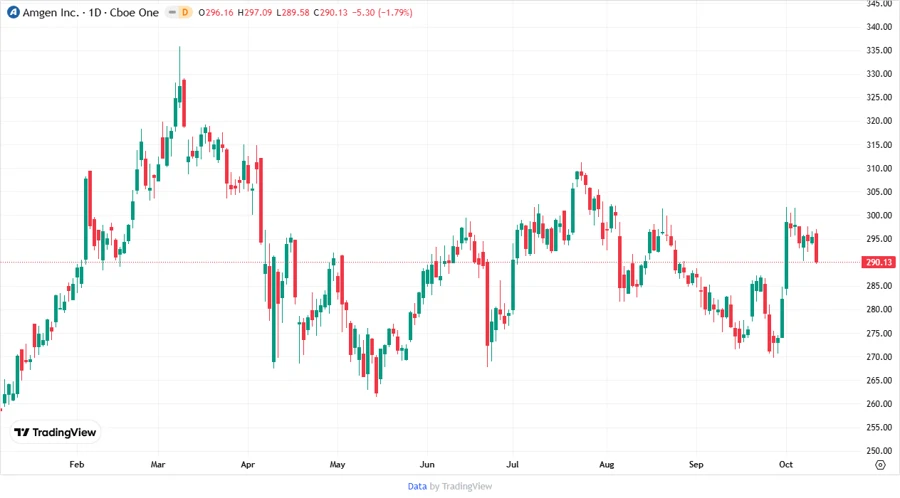
Price Development 📉
Dividend Scoring System 🎯
| Category | Score | Score Bar |
|---|---|---|
| Dividend Yield | 4 | |
| Dividend Stability | 5 | |
| Dividend Growth | 3 | |
| Payout Ratio | 3 | |
| Financial Stability | 2 | |
| Dividend Continuity | 4 | |
| Cashflow Coverage | 4 | |
| Balance Sheet Quality | 2 |
Total Score: 27/40
Rating ⭐
Overall, Amgen Inc. emerges as a sound investment for income-focused investors seeking exposure in the biotech sector. While the dividend yield and history present a compelling case, the company's leverage and payout metrics should remain under observation. Amgen is well-suited for portfolios prioritizing income continuity amidst an actively managed balance sheet and cash flow proposition.
Smart Data Insight
Master the Perfect Entry & Exit for this Stock
Don't leave your profits to chance. Historically, this stock follows specific seasonal patterns that institutional traders use to maximize returns.
- ✅ Identify the "Golden Buying Window"
- ✅ Avoid high-risk correction cycles
- ✅ Backtested data from the last 20+ years