September 21, 2025 a 07:32 am

AMGN: Dividend Analysis - Amgen Inc.
Amgen Inc. presents a strong dividend profile with a stable yield and impressive history. With no recent cuts or suspensions, it remains a reliable option for income-focused investors. The firm's consistent dividend history resonates well with its commendable growth trajectory.
Overview
Amgen, a leader in the Biopharmaceutical sector, showcases an impressive dividend yield and history, making it a lucrative choice for dividend investors.
| Metric | Details |
|---|---|
| Sector | Biopharmaceutical |
| Dividend Yield | 3.20% |
| Current Dividend per Share | 8.93 USD |
| Dividend History | 15 years |
| Last Cut or Suspension | None |
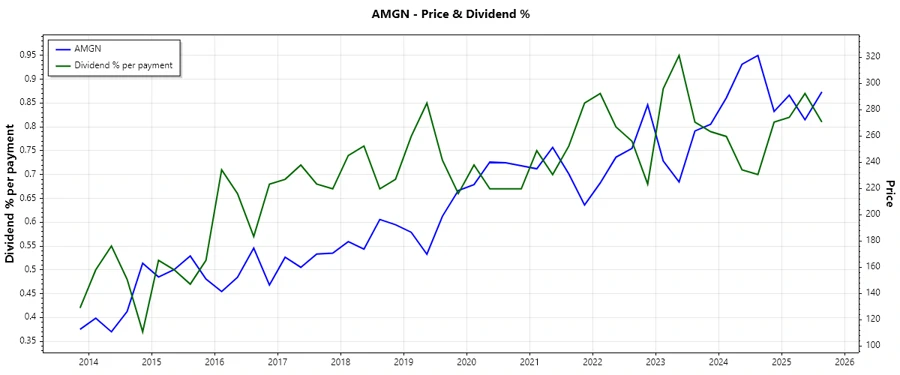
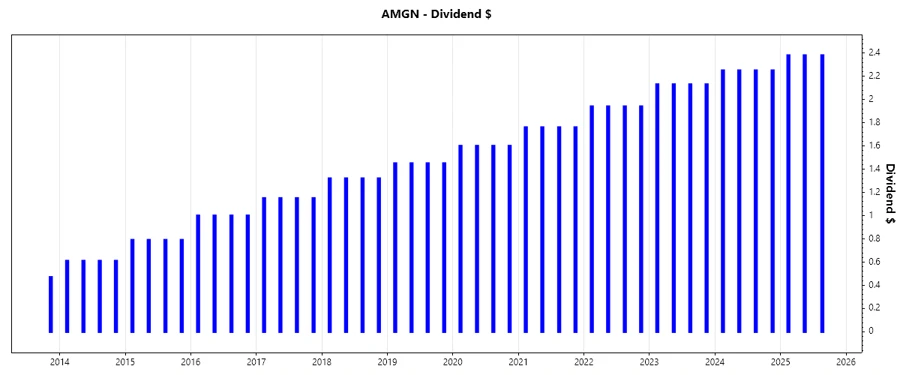
Dividend History
The robust 15-year dividend history of Amgen underscores its commitment to returning value to shareholders. This consistency is crucial for risk-averse investors seeking regular income.
| Year | Dividend per Share (USD) |
|---|---|
| 2025 | 7.14 |
| 2024 | 9.00 |
| 2023 | 8.52 |
| 2022 | 7.76 |
| 2021 | 7.04 |
Dividend Growth
Amgen has shown moderate dividend growth over the years. Continuous growth is a healthy indicator of a company's prosperity and shareholder value proposition.
| Time | Growth |
|---|---|
| 3 years | 8.53% |
| 5 years | 9.18% |
The average dividend growth is 9.18% over 5 years. This shows moderate but steady dividend growth.
Payout Ratio
Payout ratios provide insight into the sustainability of dividend payments relative to earnings and cash flow.
| Key figure | Ratio |
|---|---|
| EPS-based | 72.60% |
| Free cash flow-based | 45.34% |
The EPS-based payout ratio of 72.60% and FCF-based ratio of 45.34% suggest a balanced approach in dividend distribution, ensuring sustainable payouts.
Cashflow & Capital Efficiency
Evaluating cash flow metrics helps assess Amgen's capital efficiency and reinvestment ability.
| Metric | 2022 | 2023 | 2024 |
|---|---|---|---|
| Free Cash Flow Yield | 6.22% | 4.78% | 7.37% |
| Earnings Yield | 4.64% | 4.36% | 2.90% |
| CAPEX to Operating Cash Flow | 9.63% | 13.13% | 9.54% |
| Stock-based Compensation to Revenue | 1.52% | 1.53% | 1.59% |
| Free Cash Flow / Operating Cash Flow Ratio | 0.90 | 0.87 | 0.90 |
| Return on Invested Capital | 16.67% | 8.42% | 8.91% |
Amgen's capital efficiency remains robust, aligning with steady free cash yields and enhancing the ability for dividend support and stockholder value.
Balance Sheet & Leverage Analysis
Key leverage ratios illustrate Amgen’s financial structure and debt management proficiency.
| Metric | 2022 | 2023 | 2024 |
|---|---|---|---|
| Debt-to-Equity | 10.64 | 10.37 | 10.23 |
| Debt-to-Assets | 0.60 | 0.67 | 0.65 |
| Debt-to-Capital | 0.91 | 0.91 | 0.91 |
| Net Debt to EBITDA | 2.57 | 3.63 | 3.60 |
| Current Ratio | 1.41 | 1.65 | 1.26 |
| Quick Ratio | 1.10 | 1.13 | 0.95 |
| Financial Leverage | 17.79 | 15.59 | 15.63 |
Amgen's high financial leverage and stable debt-to-capital ratios indicate a firmbacked by solid operational cash flow, managing its obligations efficiently.
Fundamental Strength & Profitability
Analyzing profitability metrics highlights Amgen's operational effectiveness and resource utilization.
| Metric | 2022 | 2023 | 2024 |
|---|---|---|---|
| Return on Equity | 178.97% | 107.78% | 69.59% |
| Return on Assets | 10.06% | 6.91% | 4.45% |
| Net Margin | 24.89% | 23.83% | 12.24% |
| EBIT Margin | 33.25% | 38.06% | 23.23% |
| EBITDA Margin | 46.23% | 52.50% | 39.96% |
| Gross Margin | 75.66% | 70.15% | 61.53% |
| Research & Development to Revenue | 16.84% | 16.97% | 17.84% |
Amgen maintains solid profitability margins and high return metrics, demonstrating efficient capital utilization.
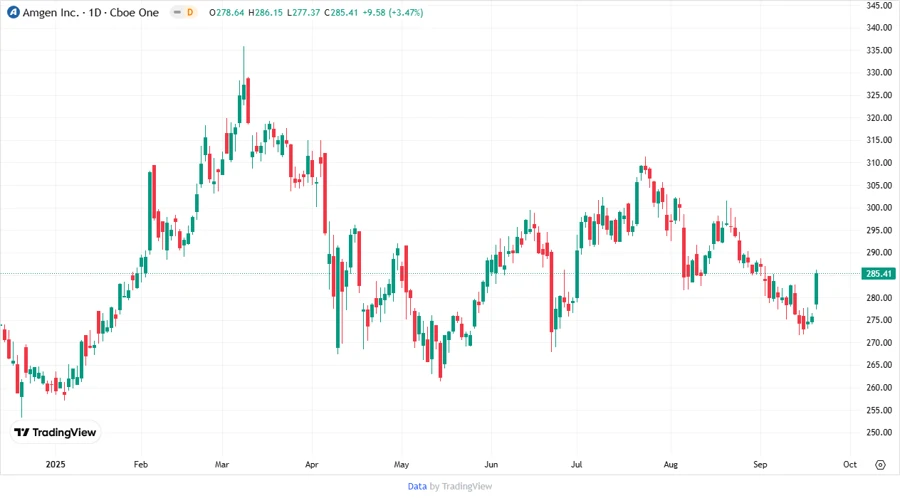
Price Development
Dividend Scoring System
| Category | Score | Score Bar |
|---|---|---|
| Dividend Yield | 4 | |
| Dividend Stability | 5 | |
| Dividend Growth | 4 | |
| Payout Ratio | 3 | |
| Financial Stability | 3 | |
| Dividend Continuity | 5 | |
| Cashflow Coverage | 4 | |
| Balance Sheet Quality | 3 |
Total Score: 31/40
Rating
Overall, Amgen Inc. offers a robust dividend-paying platform with a commendable yield and history, making it an attractive investment for dividend-oriented portfolios. The company's steady cash flow and financial metrics point towards sustained dividend distribution potential.
Smart Data Insight
Master the Perfect Entry & Exit for this Stock
Don't leave your profits to chance. Historically, this stock follows specific seasonal patterns that institutional traders use to maximize returns.
- ✅ Identify the "Golden Buying Window"
- ✅ Avoid high-risk correction cycles
- ✅ Backtested data from the last 20+ years