June 27, 2025 a 07:46 am


AMGN: Dividend Analysis - Amgen Inc.
Amgen Inc., a leading biotechnology company, offers strong dividends to its investors, showcasing a commitment to returning value. The company exhibits a robust dividend track record with a consistent growth trend, although recent growth appears moderate. Investors should note the company's payout strategy aligning with its financial strength and future earnings potential.
📊 Overview
| Metric | Value |
|---|---|
| Sector | Biotechnology |
| Dividend yield | 3.40 % |
| Current dividend per share | 8.93 USD |
| Dividend history | 15 years |
| Last cut or suspension | None |
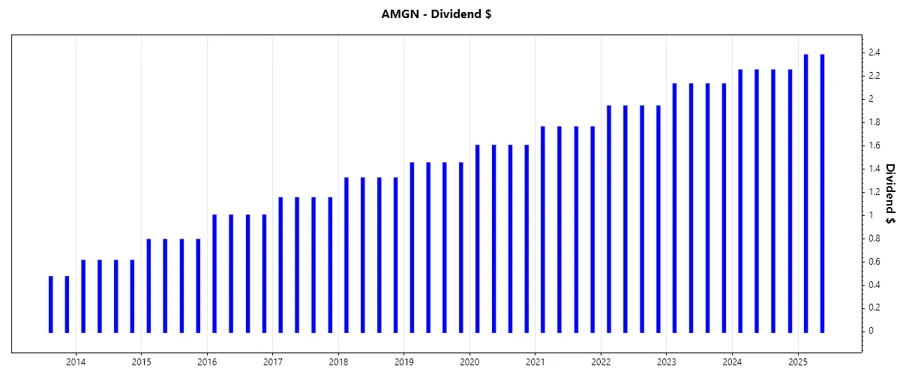
🗣️ Dividend History
The history of dividend payments reveals a stable growth trajectory over the years, reflecting the company's commitment to its shareholders. With no recent cuts, Amgen demonstrates strong financial health and management confidence in its future cash flows.
| Year | Dividend per Share (USD) |
|---|---|
| 2025 | 4.76 |
| 2024 | 9.00 |
| 2023 | 8.52 |
| 2022 | 7.76 |
| 2021 | 7.04 |
📈 Dividend Growth
Consistent dividend growth is a hallmark of Amgen's dedication to returning value to shareholders. The growth rates over the last three and five years indicate steady, albeit moderate improvement, aligning with the company's operational growth and market strategy.
| Time | Growth |
|---|---|
| 3 years | 8.53 % |
| 5 years | 9.18 % |
The average dividend growth is 9.18 % over 5 years. This shows moderate but steady dividend growth.
⚠️ Payout Ratio
The payout ratio is a crucial metric for assessing the sustainability of dividends. With an EPS payout ratio of 81% and an FCF payout ratio of 44%, Amgen maintains a balance between rewarding shareholders and retaining earnings for growth initiatives.
| Key figure ratio | Value |
|---|---|
| EPS-based | 81% |
| Free cash flow-based | 44% |
The 81% EPS payout ratio indicates a high dividend distribution relative to earnings, whereas the 44% FCF payout provides a stronger cushion, signaling sustainable dividends with room for reinvestment.
💸 Cashflow & Capital Efficiency
Understanding cash flow and capital efficiency is vital for evaluating a company's financial health. Amgen's metrics suggest efficient capital allocation and strong cash flow generation, underpinning its dividend capacity.
| Year | 2024 | 2023 | 2022 |
|---|---|---|---|
| Free Cash Flow Yield | 7.37% | 4.78% | 6.22% |
| Earnings Yield | 2.90% | 4.36% | 4.64% |
| CAPEX to Operating Cash Flow | 9.54% | 13.13% | 9.63% |
| Stock-based Compensation to Revenue | 1.59% | 1.53% | 1.52% |
| Free Cash Flow / Operating Cash Flow Ratio | 0.90 | 0.87 | 0.90 |
The stability of free cash flow and careful capital deployment are indicative of Amgen's robust financial management, bolstering shareholder value through sustainable cash distributions.
📉 Balance Sheet & Leverage Analysis
Examining Amgen's balance sheet and leverage ratios provides insights into its financial robustness and capacity to withstand economic fluctuations.
| Year | 2024 | 2023 | 2022 |
|---|---|---|---|
| Debt-to-Equity | 10.23 | 10.37 | 10.64 |
| Debt-to-Assets | 65.44% | 66.51% | 59.80% |
| Debt-to-Capital | 91.09% | 91.20% | 91.41% |
| Net Debt to EBITDA | 3.60 | 3.65 | 2.59 |
| Current Ratio | 1.26 | 1.65 | 1.41 |
| Quick Ratio | 0.95 | 1.13 | 1.10 |
| Financial Leverage | 15.63 | 15.59 | 17.79 |
Amgen's leverage illustrates substantial reliance on debt, which may pose risks if not managed prudently, yet the solid quick and current ratios assure short-term liquidity.
📊 Fundamental Strength & Profitability
Evaluating Amgen's profitability ratios reveals its operational efficiency and capacity to generate profits relative to shareholder equity and company assets.
| Year | 2024 | 2023 | 2022 |
|---|---|---|---|
| Return on Equity | 69.59% | 107.78% | 178.97% |
| Return on Assets | 4.45% | 6.91% | 10.06% |
| Margins: Net | 12.24% | 23.83% | 24.89% |
| EBIT | 23.23% | 38.06% | 33.55% |
| EBITDA | 39.96% | 52.15% | 45.94% |
| Gross | 61.53% | 70.15% | 75.66% |
| Research & Development to Revenue | 17.89% | 16.97% | 16.84% |
Amgen's superior ROE and healthy margins highlight its effective cost management and high profitability, providing confidence in the firm's sustainable financial performance.
✅ Price Development
📈 Dividend Scoring System
| Criteria | Score out of 5 | |
|---|---|---|
| Dividend yield | 4 | |
| Dividend Stability | 5 | |
| Dividend growth | 3 | |
| Payout ratio | 4 | |
| Financial stability | 3 | |
| Dividend continuity | 5 | |
| Cashflow Coverage | 4 | |
| Balance Sheet Quality | 3 |
Total Score: 31/40
Rating
Amgen Inc. is a strong dividend-paying stock, suitable for investors seeking regular income with a degree of risk awareness due to its leverage. The company demonstrates enduring financial performance, although its high leverage may require careful monitoring.
Smart Data Insight
Master the Perfect Entry & Exit for this Stock
Don't leave your profits to chance. Historically, this stock follows specific seasonal patterns that institutional traders use to maximize returns.
- ✅ Identify the "Golden Buying Window"
- ✅ Avoid high-risk correction cycles
- ✅ Backtested data from the last 20+ years