June 07, 2025 a 03:31 pm


📊 AMGN: Dividend Analysis - Amgen Inc.
Amgen Inc. presents a robust dividend profile with a stable yield and a commendable dividend growth history. The company has consistently rewarded its shareholders through regular dividend payments, and its financial metrics reflect a potentially sustainable dividend strategy. However, certain aspects such as payout ratios require careful monitoring to ensure future dividend stability.
🗣️ Overview
Amgen Inc., a prominent entity in the healthcare sector, offers investors a dividend yield of 3.40%, delivering an annual dividend of approximately $8.93 per share. With a notable 15-year history of dividend payments, the company demonstrates a commendable track record of rewarding its shareholders. Notably, there have been no recorded cuts or suspensions recently, strengthening investor confidence.
| Metric | Details |
|---|---|
| Sector | Healthcare |
| Dividend Yield | 3.40% |
| Current Dividend per Share | 8.93 USD |
| Dividend History | 15 years |
| Last Cut or Suspension | None |
📈 Dividend History
Amgen's impressive 15-year dividend history is a testament to its commitment to providing returns to its shareholders. The stability in its dividend payments is critical for investors seeking steady income. The recent dividend payments exhibit a steady, upward trend indicative of Amgen's ability to generate consistent cash flows.
| Year | Dividend per Share (USD) |
|---|---|
| 2025 | 4.76 |
| 2024 | 9.00 |
| 2023 | 8.52 |
| 2022 | 7.76 |
| 2021 | 7.04 |
📊 Dividend Growth
Dividend growth is a substantial indicator of a company's ability to enhance shareholder returns. Amgen has displayed a dividend growth rate of 8.53% over the past 3 years and 9.18% over the past 5 years. This steady growth underscores Amgen's capability to enhance shareholder value over time.
| Time Period | Growth |
|---|---|
| 3 years | 8.53% |
| 5 years | 9.18% |
The average dividend growth is 9.18% over 5 years. This shows moderate but steady dividend growth, demonstrating Amgen’s commitment toward rewarding its shareholders continually.
🎯 Payout Ratio
Understanding payout ratios is crucial as they indicate the proportion of earnings paid out as dividends. Amgen's EPS-based payout ratio stands at an elevated 81%, suggesting a significant portion of earnings are being distributed as dividends. The Free Cash Flow (FCF) payout ratio of 44% reflects more promising sustainability.
| Aspect | Ratio |
|---|---|
| EPS-based | 81% |
| Free Cash Flow-based | 44% |
An 81% EPS payout ratio might suggest pressure on earnings to sustainably maintain current dividends. However, the relatively lower FCF payout ensures that payouts are backed by operational cash flows to some extent.
📋 Cashflow & Capital Efficiency
Evaluating cash flow metrics and capital efficiency provides insights into Amgen's ability to generate and utilize capital effectively. Noteworthy metrics include a Free Cash Flow Yield of 6.99% and an Earnings Yield of 3.80%, indicative of robust cash generation and capital return.
| Year | 2024 | 2023 | 2022 |
|---|---|---|---|
| Free Cash Flow Yield | 7.37% | 4.78% | 6.22% |
| Earnings Yield | 2.90% | 4.36% | 4.64% |
| CAPEX to Operating Cash Flow | 9.54% | 13.13% | 9.63% |
| Stock-based Compensation to Revenue | 1.59% | 1.53% | 1.52% |
| Free Cash Flow / Operating Cash Flow Ratio | 90.5% | 86.9% | 90.4% |
Strong capital efficiency is observed as Amgen maintains a healthy Free Cash Flow and Operating Cash Flow, indicative of a stable cash flow system supporting its dividend strategy.
📊 Balance Sheet & Leverage Analysis
Analysis of Amgen's balance sheet and leverage metrics underscores the importance of financial health. Critical ratios such as Debt-to-Equity are relatively high, reflecting a significant debt level that calls for strategic focus on debt servicing.
| Year | 2024 | 2023 | 2022 |
|---|---|---|---|
| Debt-to-Equity | 10.23 | 10.37 | 10.64 |
| Debt-to-Assets | 0.65 | 0.67 | 0.60 |
| Debt-to-Capital | 0.91 | 0.91 | 0.91 |
| Net Debt to EBITDA | 3.60 | 3.65 | 2.59 |
| Current Ratio | 1.17 | 1.65 | 1.41 |
| Quick Ratio | 0.95 | 1.13 | 1.10 |
| Financial Leverage | 15.63 | 15.59 | 17.79 |
High leverage figures necessitate an emphasis on financial strategy to ensure continued dividend payments without compromising financial stability.
💪 Fundamental Strength & Profitability
Amgen's profitability metrics indicate strong operational performance. It is crucial to analyze profitability to gauge long-term sustainability in rewarding shareholders.
| Year | 2024 | 2023 | 2022 |
|---|---|---|---|
| Return on Equity | 69.6% | 107.8% | 178.9% |
| Return on Assets | 4.5% | 6.9% | 10.1% |
| Margins: Net | 12.2% | 23.8% | 24.9% |
| Margins: EBIT | 23.2% | 38.1% | 33.6% |
| Margins: EBITDA | 40.0% | 52.2% | 45.9% |
| Margins: Gross | 61.5% | 70.1% | 75.7% |
| Research & Development to Revenue | 17.9% | 17.0% | 16.8% |
High profitability indices confirm Amgen's ability to maintain robust operations and support its dividends. Investors can find confidence in the company’s efficient cost management and revenue utilization strategies.
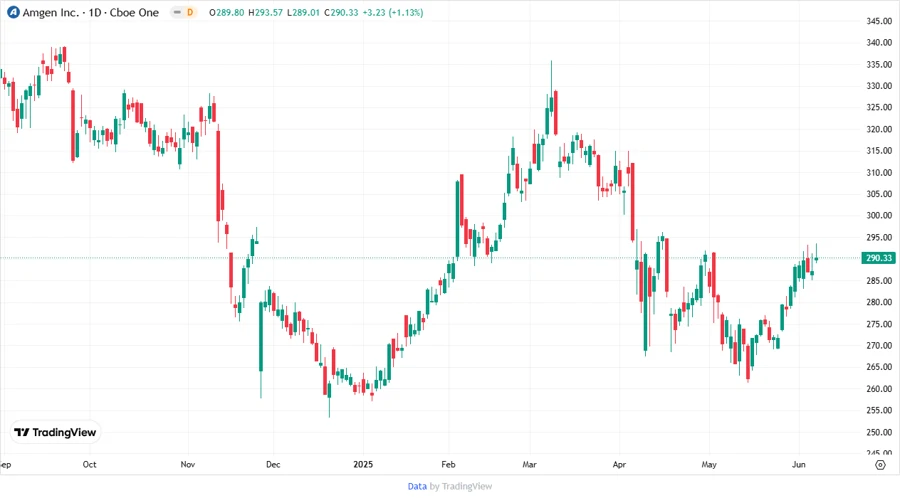
📉 Price Development
✅ Dividend Scoring System
| Criterion | Score | |
|---|---|---|
| Dividend Yield | 4/5 | |
| Dividend Stability | 4/5 | |
| Dividend Growth | 3/5 | |
| Payout Ratio | 3/5 | |
| Financial Stability | 3/5 | |
| Dividend Continuity | 5/5 | |
| Cashflow Coverage | 4/5 | |
| Balance Sheet Quality | 2/5 |
Total Score: 28/40
🏆 Rating
Amgen Inc. exhibits a solid dividend profile with a commendable history of payouts and reliable growth metrics. Although certain leverage aspects and elevated payout ratios require diligent evaluation, the existing dividend yield and historical continuity strongly support it as a favorable stock for dividend-oriented investors. Investors with a long-term perspective are likely to benefit from Amgen's consistent dividend strategy.
Smart Data Insight
Master the Perfect Entry & Exit for this Stock
Don't leave your profits to chance. Historically, this stock follows specific seasonal patterns that institutional traders use to maximize returns.
- ✅ Identify the "Golden Buying Window"
- ✅ Avoid high-risk correction cycles
- ✅ Backtested data from the last 20+ years