March 03, 2026 a 02:03 pm
AME: Trend and Support & Resistance Analysis - AMETEK, Inc.
AMETEK, Inc. (Ticker: AME) has been a prominent player in the electronics and electromechanical devices industry. The company's recent stock performance is indicative of some volatility, with fluctuations that are typical in the industry environment. The analysis shows a critical examination of technical indicators, helping to provide insights into future price movements. This detailed technical examination attempts to delineate potential support and resistance levels, key for strategic trading decisions.
Trend Analysis
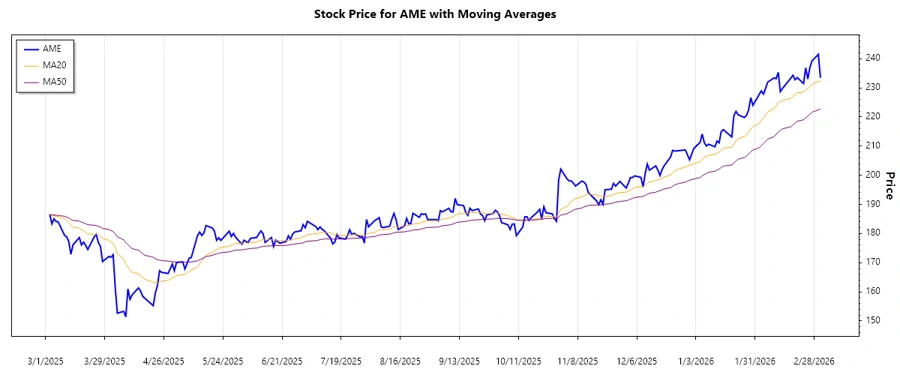
Our calculated moving averages reveal that AMETEK, Inc. is currently under a consistent trend over the past several months. By calculating the EMAs, we determine:
| Date | Close Price | Trend |
|---|---|---|
| 2026-03-03 | $233.44 | ▲ |
| 2026-03-02 | $241.46 | ▲ |
| 2026-02-27 | $239.22 | ▲ |
| 2026-02-26 | $236.96 | ▲ |
| 2026-02-25 | $233.02 | ▲ |
| 2026-02-24 | $236.84 | ▲ |
| 2026-02-23 | $231.45 | ▲ |
The consistent uptrend (indicated by EMA20 > EMA50) suggests positive momentum and potential continued growth.
Support- and Resistance
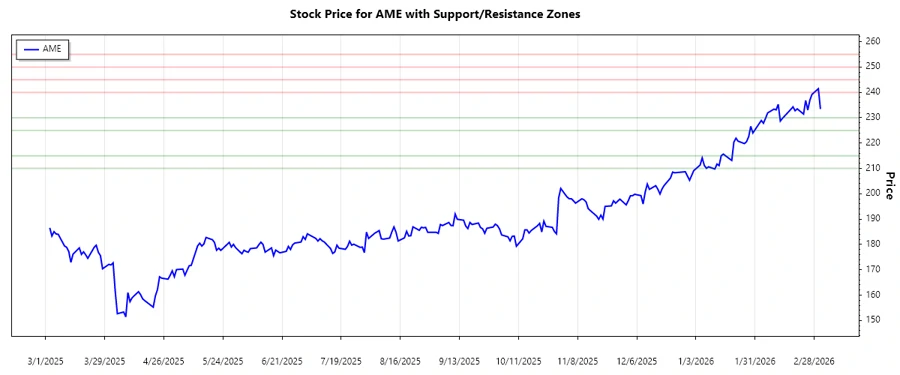
Using recent closing prices, the following support and resistance zones have been identified:
| Zone Type | From ($) | To ($) |
|---|---|---|
| Support | 210 | 215 |
| Support | 225 | 230 |
| Resistance | 240 | 245 |
| Resistance | 250 | 255 |
The current price lies in a resistance zone (240 - 245), potentially indicating upcoming price corrections or breakthroughs.
Conclusion
AMETEK shows strong upward momentum in its current trend, illustrated by its position above crucial moving averages. While resistance levels might pose challenges, the stock's dynamics suggest potential for further growth, balanced against volatility risks typical in the engineering sector. Investors should watch for price action near resistance levels as it could inform strategic buy/sell decisions, offering potential for profit in a buoyant market environment.