
September 05, 2025 a 04:03 am
AME: Trend and Support & Resistance Analysis - AMETEK, Inc.
The recent price movements of AMETEK, Inc. (AME) show a well-established pattern with clear indicators of underlying trends. With their involvement in advanced electronics and electromechanical devices across various industries, they capture wide attention from investors. In this analysis, we delve into the dominant trend using EMAs and identify vital support and resistance zones that could be pivotal for upcoming price actions.
Trend Analysis
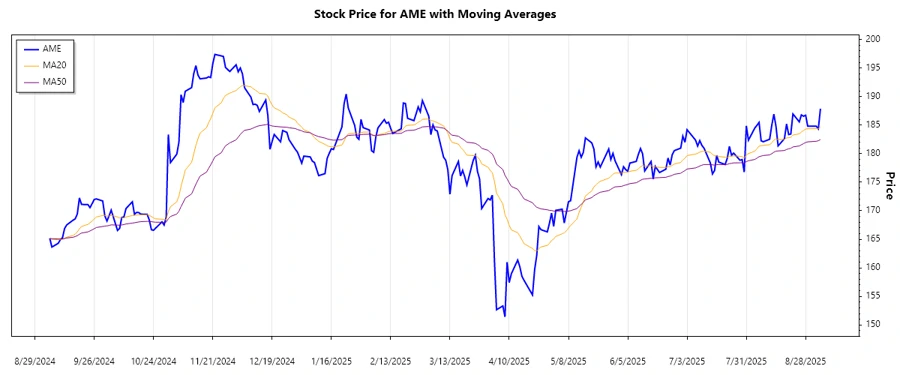
The analysis of AMETEK, Inc.'s price data up to September 4, 2025, reveals notable trends derived through EMA calculations. The 20-day EMA currently stands lower than the 50-day EMA, suggesting a descending trend forming a bearish sentiment among investors.
| Date | Close Price | Trend |
|---|---|---|
| 2025-09-04 | $187.87 | ▼ |
| 2025-09-03 | $184.35 | ▼ |
| 2025-09-02 | $184.81 | ▼ |
| 2025-08-29 | $184.80 | ▼ |
| 2025-08-28 | $186.73 | ▼ |
| 2025-08-27 | $186.55 | ▼ |
| 2025-08-26 | $186.78 | ▼ |
The steady decline in recent prices suggests a bearish outlook for the stock short-to-medium term, especially with EMA20 < EMA50.
Support and Resistance
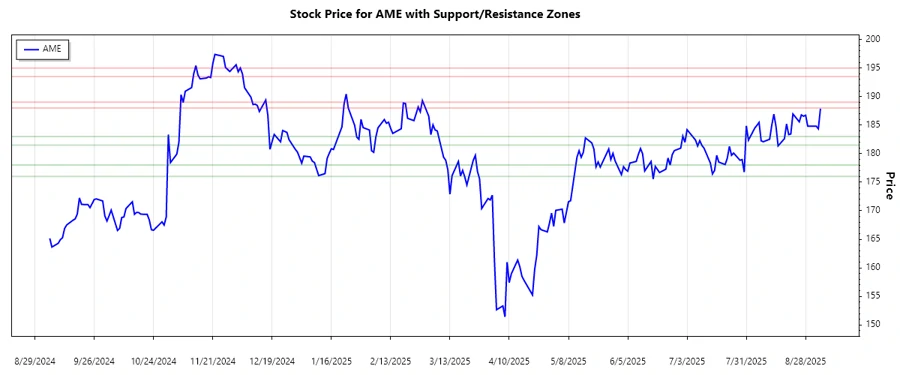
The following zones, calculated from historical price actions, define critical levels where buying or selling pressures have previously emerged:
| Zone | Price Range |
|---|---|
| Support Zone 1 | ▼ $181.50 - $183.00 ▼ |
| Support Zone 2 | ▼ $176.00 - $178.00 ▼ |
| Resistance Zone 1 | ▲ $188.00 - $189.00 ▲ |
| Resistance Zone 2 | ▲ $193.50 - $195.00 ▲ |
Currently, the stock is positioned near the resistance zone, indicating potential selling pressure and a possible reversal unless bullish momentum overrides.
Conclusion
AME's current price action provides an interesting setup for investors, highlighting clear bearish signals in the short term. As the stock trades near a key resistance zone, watch for signs of a breakthrough or reversal. While the downside risks persist, any sustained upward movement past the current resistance may reset the bearish tone. Competent monitoring of support levels is crucial to mitigate potential losses.
Smart Data Insight
Master the Perfect Entry & Exit for this Stock
Don't leave your profits to chance. Historically, this stock follows specific seasonal patterns that institutional traders use to maximize returns.
- ✅ Identify the "Golden Buying Window"
- ✅ Avoid high-risk correction cycles
- ✅ Backtested data from the last 20+ years