
May 28, 2026 a 06:44 am
AME: Fibonacci Analysis - AMETEK, Inc.
AMETEK, Inc., renowned for its robust operations in electronic instruments and electromechanical devices, demonstrates a consistent performance trend...
Fibonacci Analysis
| Parameter | Details |
|---|---|
| Trend Start Date | 2025-11-19 |
| Trend End Date | 2026-05-06 |
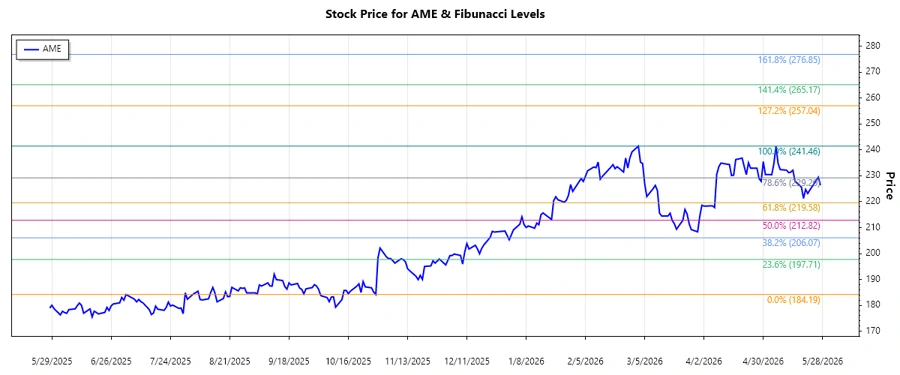
| High Price & Date | $241.46 - 2026-03-02 |
| Low Price & Date | $184.19 - 2025-10-29 |
| Fibonacci Levels |
|
| Current Retracement Zone | 0.786 |
| Technical Interpretation | The current price sits within the 0.786 retracement zone, often seen as a strong resistance level. A breakthrough may indicate bullish momentum. |
Conclusion
The analysis indicates AMETEK's stock, with its sustained uptrend, is challenging resistance levels, highlighting potential for price escalation...
Smart Data Insight
Master the Perfect Entry & Exit for this Stock
Don't leave your profits to chance. Historically, this stock follows specific seasonal patterns that institutional traders use to maximize returns.
- ✅ Identify the "Golden Buying Window"
- ✅ Avoid high-risk correction cycles
- ✅ Backtested data from the last 20+ years