March 19, 2026 a 11:45 am

AME: Fibonacci Analysis - AMETEK, Inc.
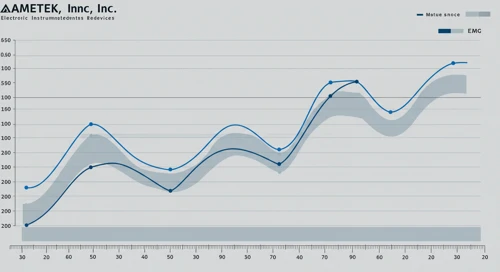
AMETEK, Inc. shows a resilient uptrend over the observed period. The company's diverse range of electronic instruments and electromechanical devices has driven consistent growth amidst fluctuating market conditions. With its strong foothold in various industrial and aerospace sectors, the stock remains a solid investment opportunity, though vigilance over potential retracement levels is advised.
Fibonacci Analysis
| Detail | Information |
|---|---|
| Trend Type | Uptrend |
| Start Date | 2025-04-21 |
| End Date | 2026-03-02 |
| High Point | $241.46 on 2026-03-02 |
| Low Point | $155.25 on 2025-04-21 |
| Fibonacci Level | Price Level |
|---|---|
| 0.236 | $188.92 |
| 0.382 | $201.52 |
| 0.5 | $213.36 |
| 0.618 | $225.20 |
| 0.786 | $241.46 |
The current price is hovering around $212.77, which places it near the 0.5 Fibonacci level. This suggests a potential support zone, indicating a common point for a reversal in the uptrend.
Conclusion
AMETEK, Inc. remains a promising candidate for investment based on its steady performance and strategic market positioning. The stock's current movement near a key Fibonacci level suggests that it may soon encounter significant support, offering a potential entry point for investors. Risks include market volatility and potential industry disruptions, but the company's innovative edge can mitigate these. Analysts should monitor upcoming financial results and broader sector trends to better evaluate future performance.