June 27, 2026 a 11:31 am


AME: Dividend Analysis - AMETEK, Inc.
AMETEK, Inc. provides a robust dividend profile, highlighted by its long-standing history of continuous dividend growth. The company exhibits strong financial fundamentals, moderate yield, and sustainable payout ratios, making it a prospective investment for dividend-seeking investors. With 43 years of dividend history, AMETEK shows a commitment to shareholder returns through dividends.
📊 Overview
| Metric | Value |
|---|---|
| Sector | Industrials |
| Dividend Yield | 0.56 % |
| Current Dividend per Share | 1.24 USD |
| Dividend History | 43 years |
| Last Cut or Suspension | None |
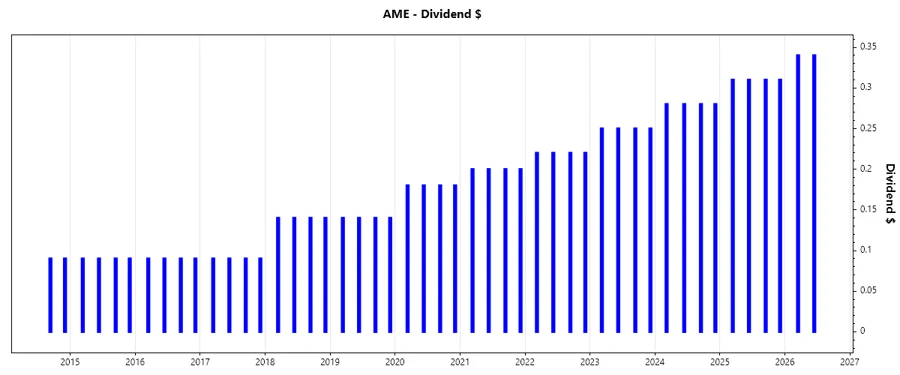
🗣️ Dividend History
AMETEK's dividend consistency is illustrated by a rich 43-year history. Persistency and growth within this duration highlight a robust financial strategy committed to delivering value to shareholders.
| Year | Dividend per Share (USD) |
|---|---|
| 2026 | 0.68 |
| 2025 | 1.24 |
| 2024 | 1.12 |
| 2023 | 1.00 |
| 2022 | 0.88 |
📈 Dividend Growth
The dividend growth rate is a critical measure of future income potential. AMETEK's growth highlights consistent capital returns to shareholders, underscoring a commitment to dividend increases.
| Time | Growth |
|---|---|
| 3 years | 12.11 % |
| 5 years | 11.49 % |
The average dividend growth is 11.49 % over 5 years. This shows moderate but steady dividend growth.
✅ Payout Ratio
Payout ratios offer insights into the sustainability of dividends, evaluating the proportion of earnings and free cash flow allocated to dividends. A sustainable ratio indicates strong management and financial health.
| Key Figure | Ratio |
|---|---|
| EPS-based | 18.55 % |
| Free cash flow-based | 16.66 % |
With an EPS payout ratio of 18.55 % and a free cash flow payout ratio of 16.66 %, AMETEK showcases disciplined financial management, ensuring dividends remain a viable long-term commitment.
📈 Cashflow & Capital Efficiency
Cash flow analysis reveals the company's typical cash usage and capital efficiency, crucial for understanding operational success and investment appeal.
| Metric | 2025 | 2024 | 2023 |
|---|---|---|---|
| Free Cash Flow Yield | 3.53% | 4.08% | 4.21% |
| Earnings Yield | 3.13% | 3.30% | 3.45% |
| CAPEX to Operating Cash Flow | 7.23% | 6.95% | 7.85% |
| Stock-based Compensation to Revenue | 0.65% | 0.69% | 0.70% |
| Free Cash Flow / Operating Cash Flow Ratio | 92.77% | 93.05% | 92.15% |
AMETEK’s steady cash flow yields and quality indicate a strong position in maintaining capital efficiency, thereby supporting sustainable operations and return on investments.
📊 Balance Sheet & Leverage Analysis
Analyzing leverage metrics provides insight into a company's debt servicing ability and financial stability, critical for evaluating liquidity and risk management.
| Metric | 2025 | 2024 | 2023 |
|---|---|---|---|
| Debt-to-Equity | 0.22 | 0.24 | 0.39 |
| Debt-to-Assets | 0.15 | 0.16 | 0.23 |
| Debt-to-Capital | 0.18 | 0.19 | 0.28 |
| Net Debt to EBITDA | 0.82 | 0.90 | 1.46 |
| Current Ratio | 1.06 | 1.24 | 0.98 |
| Quick Ratio | 0.67 | 0.75 | 0.59 |
| Financial Leverage | 1.51 | 1.52 | 1.72 |
AMETEK's strong leverage ratios and liquidity position showcase its capacity to manage and repay debt obligations effectively, ensuring financial stability and operational resilience.
❇️ Fundamental Strength & Profitability
Fundamental analysis evaluates a company's capability to convert investments into returns, crucial in determining overall financial health and investor value.
| Metric | 2025 | 2024 | 2023 |
|---|---|---|---|
| Return on Equity | 13.93% | 14.25% | 15.04% |
| Return on Assets | 9.21% | 9.41% | 8.74% |
| Net Margin | 20.00% | 19.83% | 19.91% |
| EBIT Margin | 25.40% | 25.56% | 25.59% |
| EBITDA Margin | 31.11% | 31.08% | 30.71% |
| Gross Margin | 36.38% | 35.68% | 36.14% |
| Research & Development to Revenue | 2.49% | 3.41% | 3.35% |
AMETEK's consistent profitability margins and solid returns highlight its operational efficiency and aptitude in converting revenue into profit, reflecting a robust financial standing.
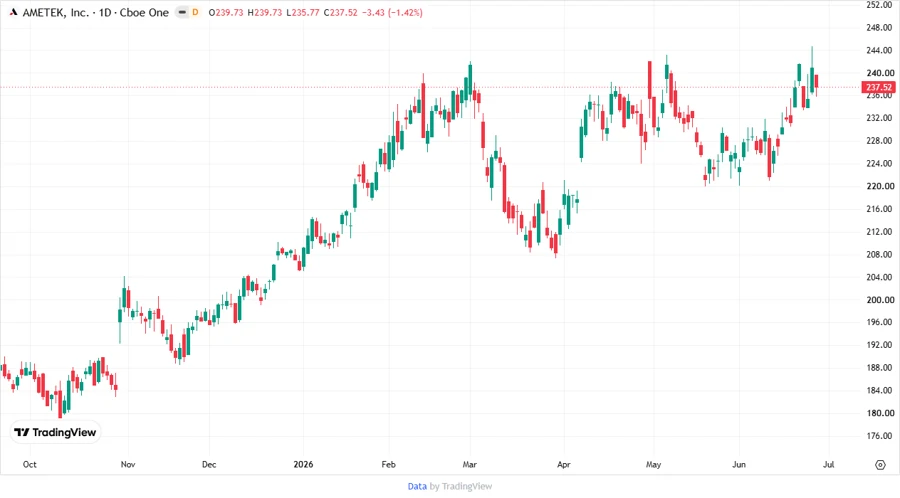
📉 Price Development
🌟 Dividend Scoring System
| Criteria | Score (1-5) | Visual |
|---|---|---|
| Dividend Yield | 2 | |
| Dividend Stability | 4 | |
| Dividend Growth | 3 | |
| Payout Ratio | 5 | |
| Financial Stability | 5 | |
| Dividend Continuity | 5 | |
| Cashflow Coverage | 4 | |
| Balance Sheet Quality | 5 |
Total Score: 33/40
🔍 Rating
Overall, AMETEK, Inc. presents a compelling investment opportunity for dividend growth investors. The company combines strong financial health, stable income, and strategic management focused on returning value to shareholders. While the dividend yield may be moderate, its reliability and continuous growth support investor confidence.
Smart Data Insight
Master the Perfect Entry & Exit for this Stock
Don't leave your profits to chance. Historically, this stock follows specific seasonal patterns that institutional traders use to maximize returns.
- ✅ Identify the "Golden Buying Window"
- ✅ Avoid high-risk correction cycles
- ✅ Backtested data from the last 20+ years