February 17, 2026 a 07:47 am

AME: Dividend Analysis - AMETEK, Inc.
AMETEK, Inc., a pioneer in the electronic instruments and electromechanical devices segments, has consistently demonstrated strong financial performance. With a remarkable 43-year streak of uninterrupted dividend payments and a significant commitment to dividend growth, AMETEK stands as a reliable investment for dividend-focused investors. Despite a modest yield, the company's growth trajectory and robust payout strategy enhance its attractiveness.
📊 Overview
Analyzing AMETEK's dividend health, the firm operates within the industrial sector, maintaining a modest dividend yield of 0.55%. The current dividend per share stands at 1.24 USD, underscoring its solid history of 43 years without any recent cuts or suspensions.
| Attribute | Value |
|---|---|
| Sector | Industrial |
| Dividend Yield | 0.55% |
| Current Dividend Per Share | 1.24 USD |
| Dividend History | 43 years |
| Last Cut or Suspension | None |
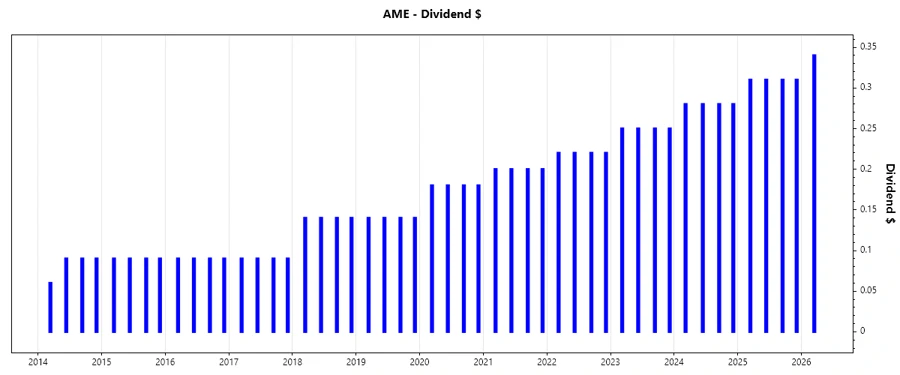
🗣️ Dividend History
AMETEK has showcased resilience in its dividend history, reflecting strong financial discipline and shareholder commitment. Such a track record often correlates with company stability, enhancing investor confidence.
| Year | Dividend per Share (USD) |
|---|---|
| 2026 | 0.34 |
| 2025 | 1.24 |
| 2024 | 1.12 |
| 2023 | 1.00 |
| 2022 | 0.88 |
📈 Dividend Growth
The dividend growth rate is a critical factor for investors seeking long-term income growth. AMETEK's consistent increases highlight its emphasis on rewarding shareholders and its ability to generate sustainable cash flows.
| Time | Growth |
|---|---|
| 3 years | 12.11% |
| 5 years | 11.49% |
The average dividend growth is 11.49% over 5 years. This shows moderate but steady dividend growth.
🔥 Payout Ratio
A low payout ratio suggests AMETEK maintains ample room to maneuver financially, allowing for potential dividend increases while simultaneously investing in growth.
| Key Figure | Ratio |
|---|---|
| EPS-based | 19.23% |
| Free cash flow-based | 25.03% |
The payout ratios of 19.23% (EPS) and 25.03% (FCF) indicate sustainable dividend practices, enabling the company to maintain a healthy balance between rewarding shareholders and preserving capital for growth.
🧮 Cashflow & Capital Efficiency
AMETEK's capital efficiency and cash flow metrics are pivotal in understanding its capability to fund dividends. Strong free cash flow indicates the ability to cover dividends without compromising operational effectiveness.
| Year | 2025 | 2024 | 2023 |
|---|---|---|---|
| Free Cash Flow Yield | - | 4.08% | 4.21% |
| Earnings Yield | 3.13% | 3.30% | 3.45% |
| CAPEX to Operating Cash Flow | - | 6.95% | 7.85% |
| Stock-based Compensation to Revenue | - | 0.69% | 0.70% |
| Free Cash Flow / Operating Cash Flow Ratio | - | 93.05% | 92.15% |
These metrics highlight AMETEK's focus on efficient capital allocation, ensuring sufficient liquidity to sustain its dividend payouts, thus increasing its dividend reliability.
👨💼 Balance Sheet & Leverage Analysis
A robust balance sheet underpins AMETEK's financial resilience, making it a reliable choice for dividends. Leverage ratios provide insights into the company's financial strategy and risk management.
| Year | 2025 | 2024 | 2023 |
|---|---|---|---|
| Debt-to-Equity | 21.48% | 24.07% | 38.65% |
| Debt-to-Assets | 14.21% | 15.89% | 22.46% |
| Debt-to-Capital | 17.68% | 19.40% | 27.88% |
| Net Debt to EBITDA | 0.97% | 0.90% | 1.46% |
| Current Ratio | 1.06 | 1.24 | 0.98 |
| Quick Ratio | 0.67 | 0.75 | 0.59 |
| Financial Leverage | 1.51 | 1.52 | 1.72 |
AMETEK's conservative leverage and strong liquidity metrics provide a stable financial base, ensuring its ability to meet obligations while investing in growth opportunities.
⚖️ Fundamental Strength & Profitability
Evaluating AMETEK's fundamental strength reveals its prowess in generating steady profits. Consistent margins and returns indicate efficient operations and a solid market position.
| Year | 2025 | 2024 | 2023 |
|---|---|---|---|
| Return on Equity | 13.93% | 14.25% | 15.04% |
| Return on Assets | 9.21% | 9.41% | 8.74% |
| Margins: Net | 19.99% | 19.83% | 19.91% |
| EBIT | 25.40% | 25.56% | 25.59% |
| EBITDA | 25.40% | 31.08% | 30.71% |
| Gross | 36.38% | 35.68% | 36.15% |
| Research & Development to Revenue | - | 3.41% | 3.35% |
AMETEK's proactive investment in research and development is evident from its growing margins, reinforcing its ability to innovate and maintain competitive leverage.
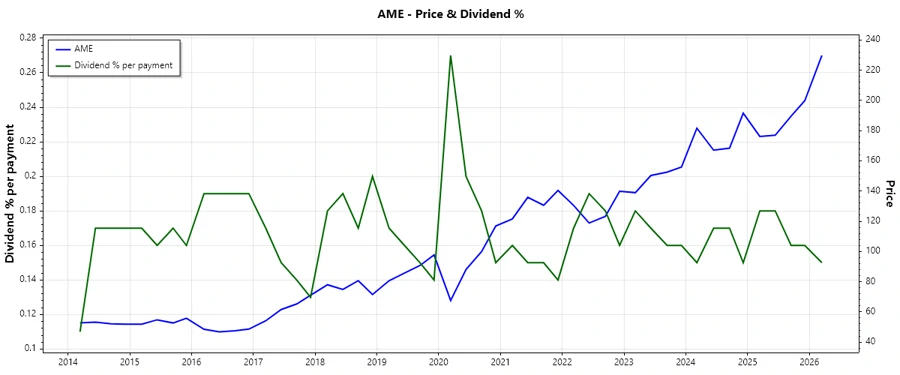
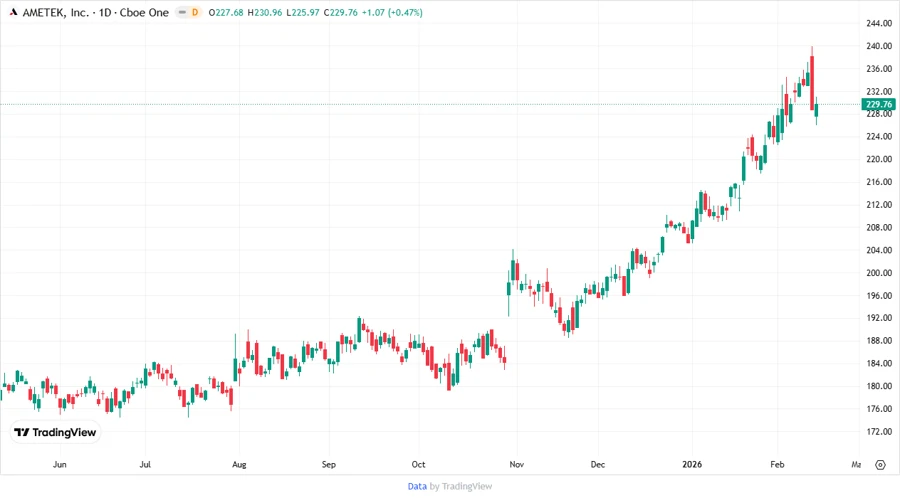
🏷️ Price Development
🔍 Dividend Scoring System
| Criteria | Score | Rating |
|---|---|---|
| Dividend yield | 3 | |
| Dividend Stability | 5 | |
| Dividend Growth | 4 | |
| Payout Ratio | 5 | |
| Financial Stability | 4 | |
| Dividend Continuity | 5 | |
| Cashflow Coverage | 4 | |
| Balance Sheet Quality | 4 |
Overall Score: 34/40
✅ Rating
Based on comprehensive analysis, AMETEK, Inc. presents itself as a highly attractive candidate for dividend-focused investors. The company's consistent dividend track record, robust financial health, and ample growth potential merit a strong buy recommendation.