February 02, 2026 a 07:31 am
AME: Dividend Analysis - AMETEK, Inc.
AMETEK, Inc. exhibits a resilient dividend profile, marked by a 42-year history of uninterrupted dividend payments and substantial growth. With a modest dividend yield, the company's low payout ratios indicate a strong capacity for sustaining dividends, supplemented by a healthy balance sheet and consistent earnings performance.
📊 Overview
AMETEK, Inc. operates within a robust sector, displaying a careful balance between growth and stability through its dividend strategy. The company's long-standing dividend history, coupled with a progressive approach to dividend expansion, offers a reliable income stream for investors.
| Metric | Value |
|---|---|
| Sector | Industrials |
| Dividend Yield | 0.62% |
| Current Dividend Per Share | 1.12 USD |
| Dividend History | 42 years |
| Last Cut or Suspension | 1998 |
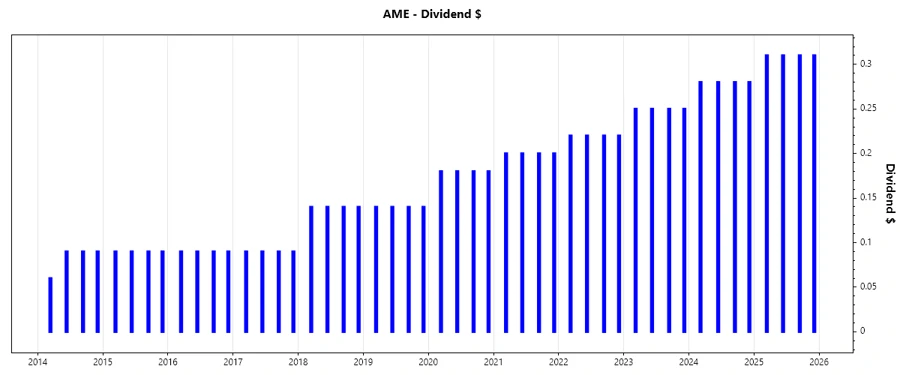
📉 Dividend History
The steadiness of AMETEK's dividend policy is a bedrock of its financial strategy, earning investor trust through consistent payouts. This history speaks volumes of its cash flow management and profit-generation capabilities.
| Year | Dividend Per Share (USD) |
|---|---|
| 2025 | 1.24 |
| 2024 | 1.12 |
| 2023 | 1.00 |
| 2022 | 0.88 |
| 2021 | 0.80 |
📈 Dividend Growth
Steady dividend growth is a testament to AMETEK's robust earnings and sustainable business model. Assessing its historical dividend increases provides insight into management's confidence in future growth.
| Time | Growth |
|---|---|
| 3 years | 12.11% |
| 5 years | 11.49% |
The average dividend growth is 11.49% over 5 years. This shows moderate but steady dividend growth.
✅ Payout Ratio
A keen evaluation of AMETEK's payout ratios reveals its prudent approach to financial management, balancing dividend payouts with retained earnings to fuel future growth.
| Key Figure | Ratio |
|---|---|
| EPS-based | 17.58% |
| Free cash flow-based | 15.73% |
AMETEK's low payout ratios suggest ample room for future dividend increases, ensuring stability while preserving capital for reinvestment.
Cashflow & Capital Efficiency
Understanding AMETEK's cash flow positions and capital efficiency provides insights into its operational sustainability and strategic management of resources.
| Year | 2024 | 2023 | 2022 |
|---|---|---|---|
| Free Cash Flow Yield | 4.08% | 4.21% | 3.12% |
| Earnings Yield | 3.30% | 3.45% | 3.58% |
| CAPEX to Operating Cash Flow | 7.05% | 7.85% | 12.09% |
| Stock-based Compensation to Revenue | 0.69% | 0.70% | 0.77% |
| Free Cash Flow / Operating Cash Flow Ratio | 93.05% | 92.15% | 87.91% |
AMETEK's cash flow and capital efficiency metrics highlight its capacity to generate robust internal cash flows and efficiently allocate capital for growth opportunities.
Balance Sheet & Leverage Analysis
Analyzing AMETEK's balance sheet metrics illustrates its capability in maintaining financial stability and a manageable debt profile, underlining its resilience in varied economic environments.
| Year | 2024 | 2023 | 2022 |
|---|---|---|---|
| Debt-to-Equity | 0.24 | 0.39 | 0.34 |
| Debt-to-Assets | 0.16 | 0.22 | 0.21 |
| Debt-to-Capital | 0.19 | 0.28 | 0.26 |
| Net Debt to EBITDA | 0.90 | 1.46 | 1.21 |
| Current Ratio | 1.24 | 0.98 | 1.62 |
| Quick Ratio | 0.75 | 0.59 | 0.95 |
| Financial Leverage | 1.52 | 1.72 | 1.66 |
AMETEK's disciplined leverage management ensures a favorable financial position that's conducive for sustaining operations and pursuing growth initiatives.
Fundamental Strength & Profitability
Scrutinizing AMETEK's key profitability ratios and return metrics showcases its operational soundness and ability to convert revenues into tangible profits.
| Year | 2024 | 2023 | 2022 |
|---|---|---|---|
| Return on Equity | 14.25% | 15.04% | 15.51% |
| Return on Assets | 9.41% | 8.74% | 9.33% |
| Return on Invested Capital | 11.13% | 10.25% | 10.93% |
| Net Margin | 19.83% | 19.91% | 18.85% |
| EBIT Margin | 25.56% | 25.59% | 24.58% |
| EBITDA Margin | 31.08% | 30.71% | 29.77% |
| Gross Margin | 35.68% | 36.14% | 34.88% |
| R&D to Revenue | 3.41% | 3.35% | 3.23% |
AMETEK's solid profitability metrics, underpinned by efficient cost management, highlight its operational efficacy and strong industry positioning.
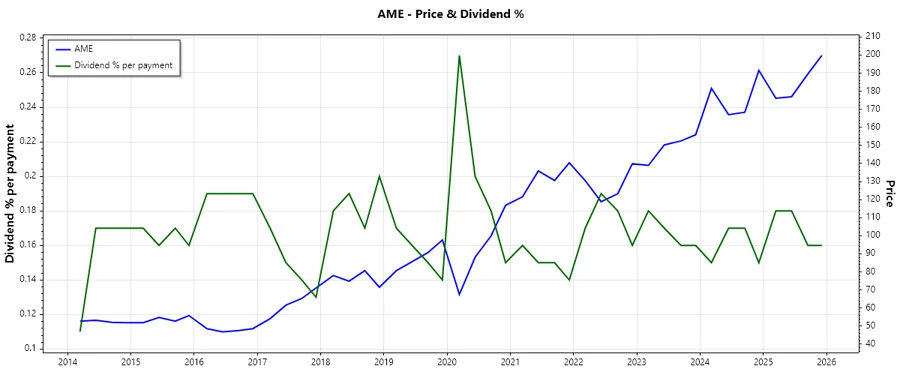
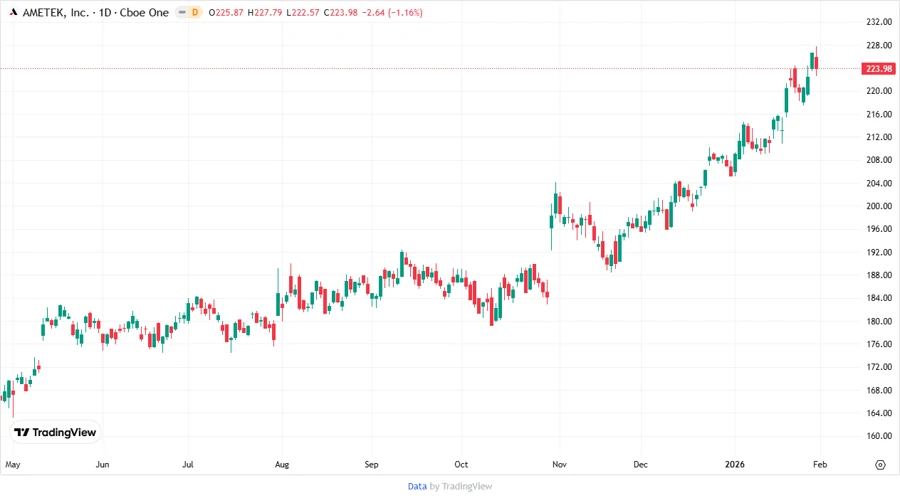
🏷️ Price Development
🗝️ Dividend Scoring System
| Category | Score (1-5) | Visual Score |
|---|---|---|
| Dividend Yield | 2 | |
| Dividend Stability | 5 | |
| Dividend Growth | 4 | |
| Payout Ratio | 5 | |
| Financial Stability | 5 | |
| Dividend Continuity | 5 | |
| Cashflow Coverage | 4 | |
| Balance Sheet Quality | 5 |
Total Score: 35/40
Rating
AMETEK, Inc. exudes financial strength with an enviable dividend history, reliable growth, and robust performance across key financial metrics. The company's disciplined approach to balance sheet management and strategic investment in growth make it a favorable choice for dividend-oriented investors seeking consistency and resilience in their portfolios.
Smart Data Insight
Master the Perfect Entry & Exit for this Stock
Don't leave your profits to chance. Historically, this stock follows specific seasonal patterns that institutional traders use to maximize returns.
- ✅ Identify the "Golden Buying Window"
- ✅ Avoid high-risk correction cycles
- ✅ Backtested data from the last 20+ years