November 25, 2025 a 03:31 pm

AME: Dividend Analysis - AMETEK, Inc.
AMETEK, Inc. exhibits a formidable dividend profile with a consistent history of payouts and robust growth metrics. Its strategic positioning in the electronics sector underpins a stable revenue stream, reflected in its favorable financial ratios. Caution is advised concerning the relatively low dividend yield, counterbalanced by steady growth and payout stability. This makes AMETEK a potential candidate for dividend growth investors.
📊 Overview
AMETEK, Inc. operates within the electronics sector, characterized by technological advancements and innovation, which supports its dividend-paying ability. The company maintains an impressive dividend history of 42 years without significant cuts since 1998.
| Attribute | Details |
|---|---|
| Sector | Electronics |
| Dividend yield | 0.64 % |
| Current dividend per share | $1.12 USD |
| Dividend history | 42 years |
| Last cut or suspension | 1998 |
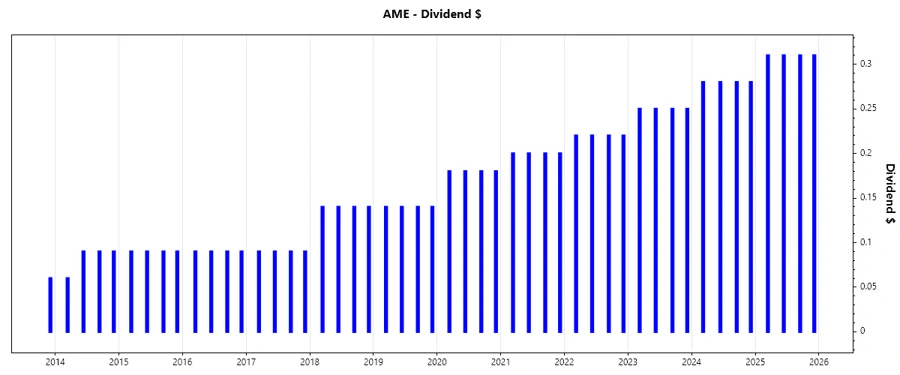
📈 Dividend History
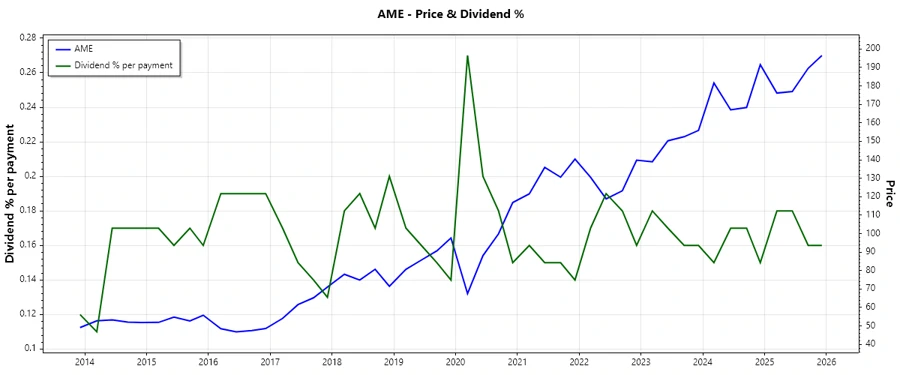
AMETEK's substantial dividend history demonstrates corporate commitment to returning shareholder value. This historical consistency provides confidence in dividend reliability despite market fluctuations.
| Year | Dividend per Share (USD) |
|---|---|
| 2025 | 1.24 |
| 2024 | 1.12 |
| 2023 | 1.00 |
| 2022 | 0.88 |
| 2021 | 0.80 |
📉 Dividend Growth
The dividend growth rate is a crucial indicator reflecting AMETEK's potential to increase dividend payments over time. A robust growth in dividends ensures the attractiveness of the stock for income investors.
| Time | Growth |
|---|---|
| 3 years | 11.87 % |
| 5 years | 14.87 % |
The average dividend growth is 14.87 % over 5 years. This shows moderate but steady dividend growth.
✅ Payout Ratio
The payout ratio assesses the sustainability of dividend payments by comparing it to earnings and cash flow. A low ratio indicates a conservative and sustainable payout policy, leaving room for future growth.
| Key Figure | Ratio |
|---|---|
| EPS-based | 17.58 % |
| Free cash flow-based | 15.73 % |
With a EPS payout ratio of 17.58 % and a FCF payout ratio of 15.73 %, AMETEK effectively balances earnings reinvestment and dividend payment, supporting future increases.
📊 Cashflow & Capital Efficiency
Efficient capital allocation and strong cash flow generation are vital for sustaining dividends and funding growth initiatives.
| Metric | 2024 | 2023 | 2022 |
|---|---|---|---|
| Free Cash Flow Yield | 4.08 % | 4.21 % | 3.12 % |
| Earnings Yield | 3.30 % | 3.45 % | 3.58 % |
| CAPEX to Operating Cash Flow | 6.95 % | 7.85 % | 12.09 % |
| Stock-based Compensation to Revenue | 0.69 % | 0.70 % | 0.77 % |
| Free Cash Flow / Operating Cash Flow Ratio | 93.05 % | 92.14 % | 87.91 % |
AMETEK's cash flow metrics indicate strong efficiency, underpinning its capability to maintain and grow its dividend alongside capital investments.
🗣️ Balance Sheet & Leverage Analysis
AMETEK's financial structure is scrutinized for debt sustainability and liquidity. A sound balance sheet mitigates financial risks and enhances resilience.
| Metric | 2024 | 2023 | 2022 |
|---|---|---|---|
| Debt-to-Equity | 24.07 % | 38.65 % | 34.25 % |
| Debt-to-Assets | 15.89 % | 22.46 % | 20.60 % |
| Debt-to-Capital | 19.40 % | 27.88 % | 25.51 % |
| Net Debt to EBITDA | 0.90 | 1.46 | 1.21 |
| Current Ratio | 1.24 | 0.98 | 1.62 |
| Quick Ratio | 0.75 | 0.59 | 0.95 |
| Financial Leverage | 1.52 | 1.72 | 1.66 |
The balance sheet reflects prudent management of leverage, ensuring that AMETEK is well-positioned to navigate financial obligations and sustain strategic operations.
📈 Fundamental Strength & Profitability
Profitability metrics superior to industry averages enhance AMETEK's ability to sustain dividends and deliver returns to shareholders.
| Metric | 2024 | 2023 | 2022 |
|---|---|---|---|
| Return on Equity | 14.25 % | 15.04 % | 15.51 % |
| Return on Assets | 9.41 % | 8.74 % | 9.33 % |
| Net Margin | 19.83 % | 19.91 % | 18.85 % |
| EBIT Margin | 25.56 % | 25.59 % | 24.58 % |
| EBITDA Margin | 31.08 % | 30.71 % | 29.77 % |
| Gross Margin | 35.68 % | 36.14 % | 34.88 % |
| R&D to Revenue | 3.41 % | 3.35 % | 3.23 % |
AMETEK's consistent profitability metrics highlight its operational efficiencies and ability to sustain competitive advantages.
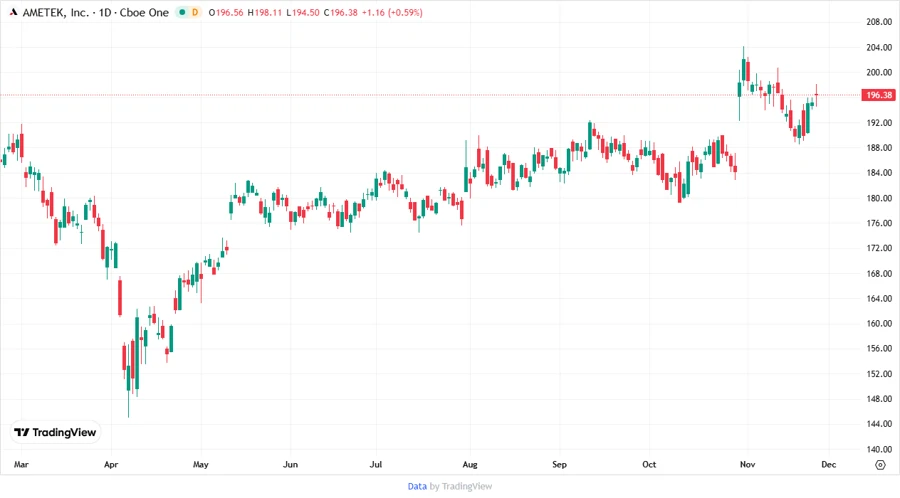
🌟 Price Development
📏 Dividend Scoring System
| Criteria | Score | Bar |
|---|---|---|
| Dividend yield | 3 | |
| Dividend Stability | 5 | |
| Dividend growth | 4 | |
| Payout ratio | 5 | |
| Financial stability | 4 | |
| Dividend continuity | 5 | |
| Cashflow Coverage | 4 | |
| Balance Sheet Quality | 4 |
Total Score: 34 / 40
🗣️ Rating
Based on a comprehensive analysis of its dividend history, growth potential, financial health, and risk metrics, AMETEK, Inc. presents a compelling option for dividend growth investors seeking stable income and capital appreciation. The low dividend yield could be a limiting factor for income-focused investors.