
July 13, 2026 a 11:30 am
AMCR: Dividend Analysis - Amcor plc
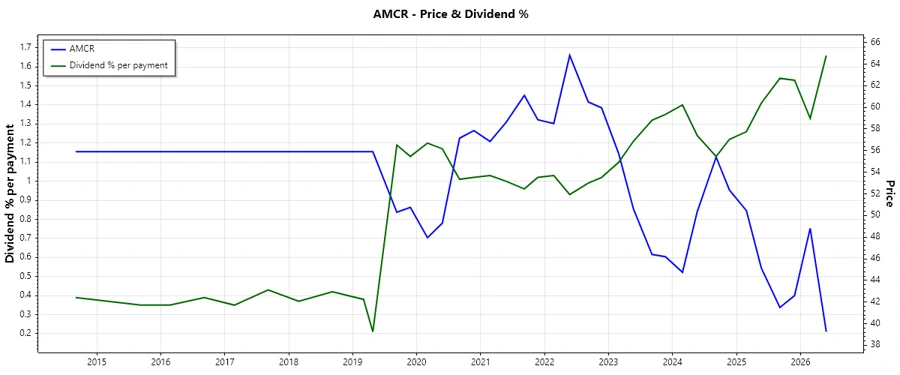
Amcor plc offers an impressive dividend yield of 6.59%, showcasing a robust return for income-focused investors. With a consistent dividend history spanning 13 years, the company's commitment to shareholder returns is evident. However, the high payout ratios raise questions about the sustainability of these dividends in the long term.
📊 Overview
Amcor plc operates within the packaging sector, where cash flow management and capital efficiency are critical. Below is a summary of key dividend-related metrics:
| Item | Description |
|---|---|
| Sector | Packaging |
| Dividend yield | 6.59% |
| Current dividend per share | 2.66 USD |
| Dividend history | 13 years |
| Last cut or suspension | None |
📈 Dividend History
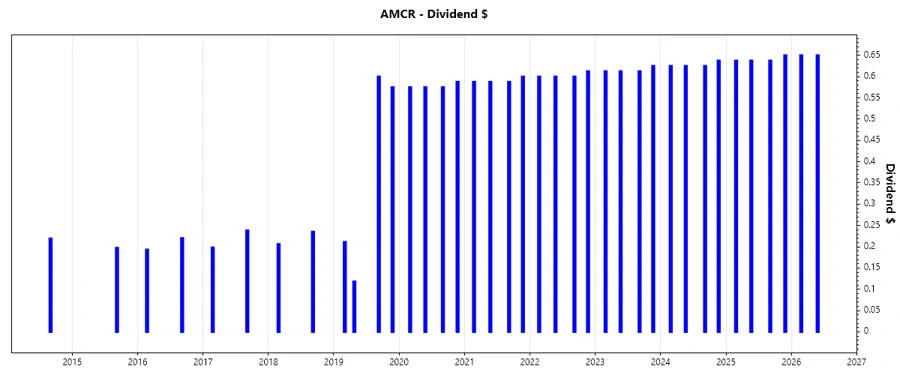
A strong dividend history is essential for assessing a company's financial health and commitment to shareholders. Amcor has maintained a stable dividend for over a decade, indicating robust cash generation capabilities.
| Year | Dividend Per Share |
|---|---|
| 2026 | 1.30 |
| 2025 | 2.5625 |
| 2024 | 2.5125 |
| 2023 | 2.4625 |
| 2022 | 2.4125 |
📊 Dividend Growth
Tracking growth in dividends provides insights into a company’s profitability trends and financial strategy. Below is the recent dividend growth data for Amcor:
| Time | Growth |
|---|---|
| 3 years | 2.03% |
| 5 years | 2.07% |
The average dividend growth is approximately 2.07% over 5 years. This shows moderate but steady dividend growth.
✅ Payout Ratio
The payout ratio is crucial for evaluating how much of its earnings a company is returning to shareholders versus reinvesting for growth. Here's Amcor's current payout ratio data:
| Key figure | Ratio |
|---|---|
| EPS-based | 181.73% |
| Free cash flow-based | 101.03% |
With a payout ratio of 181.73% based on EPS, the dividend may not be sustainable in the long run, especially if earnings growth does not pick up. Similarly, the FCF payout ratio of 101.03% indicates potential pressure on maintaining dividend levels if cash flows were to decrease.
🗣️ Cashflow & Capital Efficiency
Amcor's ability to generate free cash flow and efficiently manage its capital investment is essential for sustaining dividend payouts and driving growth. The table below provides a multi-year view of these critical metrics:
| Year | 2025 | 2024 | 2023 |
|---|---|---|---|
| Free Cash Flow Yield | 5.55% | 6.00% | 5.02% |
| Earnings Yield | 3.50% | 5.28% | 7.15% |
| CAPEX to Operating Cash Flow | 41.73% | 37.24% | 41.71% |
| Stock-based Compensation to Revenue | 0.49% | 0.23% | 0.37% |
| Free Cash Flow / Operating Cash Flow Ratio | 58.27% | 62.76% | 58.29% |
| Return on Invested Capital | 2.64% | 8.05% | 10.11% |
The mixed stability of free cash flow and operating cash flow ratios in recent years suggests that while Amcor can cover its operational expenses, further attention to CAPEX and compensation costs is necessary to optimize returns and sustain dividends.
⚠️ Balance Sheet & Leverage Analysis
A company's balance sheet reveals its financial strength and ability to manage debt. Here's how Amcor fares in key leverage metrics:
| Year | 2025 | 2024 | 2023 |
|---|---|---|---|
| Debt-to-Equity | 1.28 | 1.85 | 1.79 |
| Debt-to-Assets | 40.49% | 43.49% | 42.40% |
| Debt-to-Capital | 56.13% | 64.93% | 64.17% |
| Net Debt to EBITDA | 8.02x | 3.57x | 3.07x |
| Current Ratio | 1.21 | 1.17 | 1.19 |
| Quick Ratio | 0.71 | 0.69 | 0.69 |
| Financial Leverage | 3.16 | 4.26 | 4.22 |
Amcor's leverage position demonstrates higher debt levels, especially evident in past years. A careful approach to reducing debt could improve financial flexibility, essential for maintaining dividends and accommodating expansions.
📉 Fundamental Strength & Profitability
Profitability ratios are pivotal in understanding how effectively a company can convert revenues into profit. Below are salient profitability metrics for Amcor:
| Year | 2025 | 2024 | 2023 |
|---|---|---|---|
| Return on Equity | 4.36% | 18.81% | 26.03% |
| Return on Assets | 1.38% | 4.42% | 6.16% |
| Net Margin | 3.40% | 5.35% | 7.13% |
| EBIT Margin | 6.97% | 9.20% | 10.49% |
| EBITDA Margin | 11.78% | 13.56% | 14.48% |
| Gross Margin | 18.88% | 19.88% | 18.54% |
| R&D to Revenue | 0.80% | 0.78% | 0.69% |
While profit margins reflect strategic pricing and cost management capabilities, a focus on boosting return metrics is needed to leverage operational efficiencies fully. Increased investment in R&D as a percent of revenue suggests a push towards innovation, promising for long-term returns.
📈 Price Development
✅ Dividend Scoring System
Our dividend scoring system grades companies on multiple financial metrics to assess dividend reliability and growth prospects. Here's Amcor's score:
| Category | Score (Out of 5) | Score Bar |
|---|---|---|
| Dividend yield | 4 | |
| Dividend Stability | 3 | |
| Dividend growth | 2 | |
| Payout ratio | 2 | |
| Financial stability | 3 | |
| Dividend continuity | 4 | |
| Cashflow Coverage | 3 | |
| Balance Sheet Quality | 3 |
Total Score: 24/40
🗣️ Rating
Amcor plc presents a mixed dividend profile, characterized by a high yield yet challenged by extensive payout ratios. Investors may benefit from the current high yield, but continued vigilance on financial ratios and operational improvements is warranted to verify the ongoing reliability of future payouts. The scoring suggests a moderate opportunity, fitting more speculative long-term dividend portfolios.
Smart Data Insight
Master the Perfect Entry & Exit for this Stock
Don't leave your profits to chance. Historically, this stock follows specific seasonal patterns that institutional traders use to maximize returns.
- ✅ Identify the "Golden Buying Window"
- ✅ Avoid high-risk correction cycles
- ✅ Backtested data from the last 20+ years