
May 28, 2026 a 07:46 am
AMCR: Dividend Analysis - Amcor plc
Amcor plc stands out with its robust dividend yield and consistent payment history. However, its elevated EPS and free cash flow payout ratios may raise sustainability concerns. The company displays steady dividend growth, marking its attractiveness for income-focused investors. Nonetheless, investors should be cautious about its current leverage levels and payout ratios.
📊 Overview
Amcor plc operates in the packaging sector, renowned for its extensive range of packaging solutions. Its current dividend yield is positioned at an impressive 6.52%, signaling significant income potential for shareholders. The company has maintained a 13-year run of consistent dividend payments, reflecting robust financial health and commitment to returning capital to shareholders. However, recent analysis highlights challenges with the payout ratios, necessitating careful future monitoring.
| Metric | Details |
|---|---|
| Sector | Packaging |
| Dividend yield | 6.52% |
| Current dividend per share | 2.66 USD |
| Dividend history | 13 years |
| Last cut or suspension | None |
🗣️ Dividend History
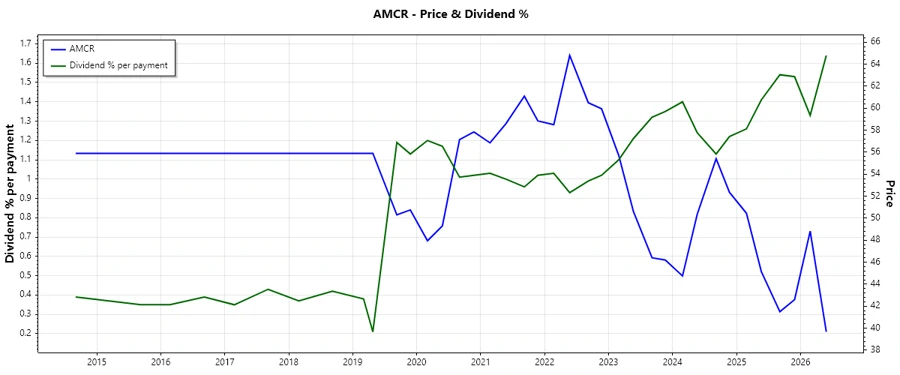
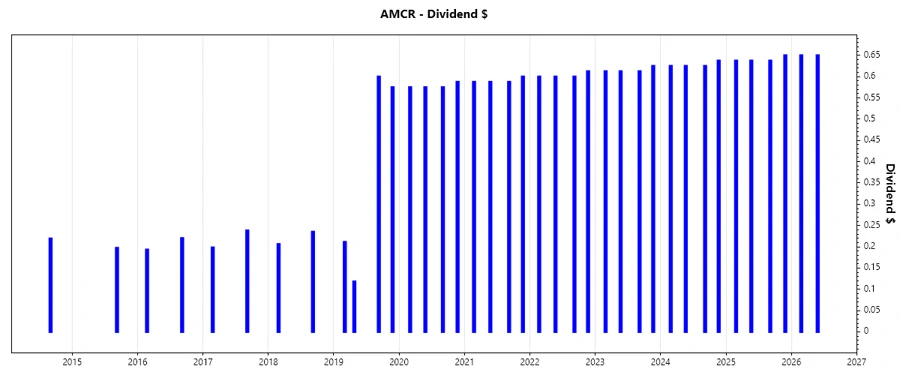
Amcor plc's consistent dividend history over 13 years signifies reliability and commitment to shareholders. This track-record is invaluable for investors seeking stable income. The recent dividend payments reflect minor incremental growth, demonstrating the company's conservative income strategy.
| Year | Dividend per Share (USD) |
|---|---|
| 2026 | 1.30 |
| 2025 | 2.56 |
| 2024 | 2.51 |
| 2023 | 2.46 |
| 2022 | 2.41 |
📈 Dividend Growth
Amcor plc showcases a stable, albeit modest, dividend growth rate, with 0.02% over the past 3 and 5 years. This growth rate underscores the company's consistent approach amidst varying market conditions and reinforces the appeal for long-term investors.
| Time | Growth |
|---|---|
| 3 years | 2.03% |
| 5 years | 2.07% |
The average dividend growth is 2.07% over 5 years. This shows moderate but steady dividend growth.
✅ Payout Ratio
Careful scrutiny of payout ratios highlights the sustainability of Amcor's dividends. A payout ratio above 100% signals higher risk of unsustainable dividend distribution, necessitating close monitoring of earnings consistency and cash flow health.
| Key figure ratio | Percentage |
|---|---|
| EPS-based | 181.73% |
| Free cash flow-based | 101.03% |
The EPS-based payout ratio of 181.73% is significantly high, warranting caution as it indicates potential overstretching of earnings. The free cash flow-based payout ratio at 101.03% also suggests close attention to cash flow health is needed.
📊 Cashflow & Capital Efficiency
Analyzing cash flow metrics and capital efficiency reveals the strength of Amcor's operational management. These ratios are essential for assessing the company's ability to sustain operations and drive profitable growth through optimal capital allocation.
| Year | Free Cash Flow Yield | Earnings Yield | CAPEX/OCF | Stock-based Compensation/Revenue | Free Cash Flow / OCF Ratio |
|---|---|---|---|---|---|
| 2025 | 5.55% | 3.50% | 41.73% | 0.24% | 58.27% |
| 2024 | 6.00% | 3.50% | 37.24% | 0.23% | 62.76% |
| 2023 | 5.02% | 3.69% | 41.71% | 0.37% | 58.29% |
The stability in cash flow and capital allocation is critical for Amcor's financial health and shareholder retentions. Precision in CAPEX allocation influences future growth trajectory and margin sustainability.
⚠️ Balance Sheet & Leverage Analysis
Amcor's balance sheet analysis highlights the company's leverage, crucial for understanding its financial health in backing dividend commitments. These ratios ensure that the company's debt management is sustainable, mitigating financial risk.
| Year | Debt-to-Equity | Debt-to-Assets | Debt-to-Capital | Net Debt to EBITDA | Current Ratio | Quick Ratio |
|---|---|---|---|---|---|---|
| 2025 | 127.97% | 40.49% | 56.13% | 8.02 | 1.20 | 0.71 |
| 2024 | 185.18% | 43.49% | 64.93% | 3.57 | 1.17 | 0.69 |
| 2023 | 179.06% | 42.40% | 64.17% | 3.06 | 1.19 | 0.69 |
High debt ratios necessitate prudent financial management to uphold balance sheet integrity. Amcor's financial strategies should focus on reducing leverage, enhancing liquidity, and maintaining fiscal discipline.
📊 Fundamental Strength & Profitability
Evaluating fundamental strength and profitability assists in understanding Amcor's long-term value creation ability. Critical metrics such as return on equity and profit margins showcase operational efficiency and profitability prowess.
| Year | Return on Equity | Return on Assets | Net Margin | EBIT Margin | EBITDA Margin | R&D/Revenue |
|---|---|---|---|---|---|---|
| 2025 | 4.36% | 1.38% | 3.40% | 6.97% | 11.78% | 0.80% |
| 2024 | 18.81% | 4.42% | 5.35% | 9.20% | 13.56% | 0.78% |
| 2023 | 26.03% | 6.16% | 7.13% | 10.49% | 14.48% | 0.69% |
Amcor's robust profitability metrics in recent years suggest strong management performance and competitive advantage. However, sustaining these levels will be crucial to withstand sectoral volatilities and drive long-term growth.
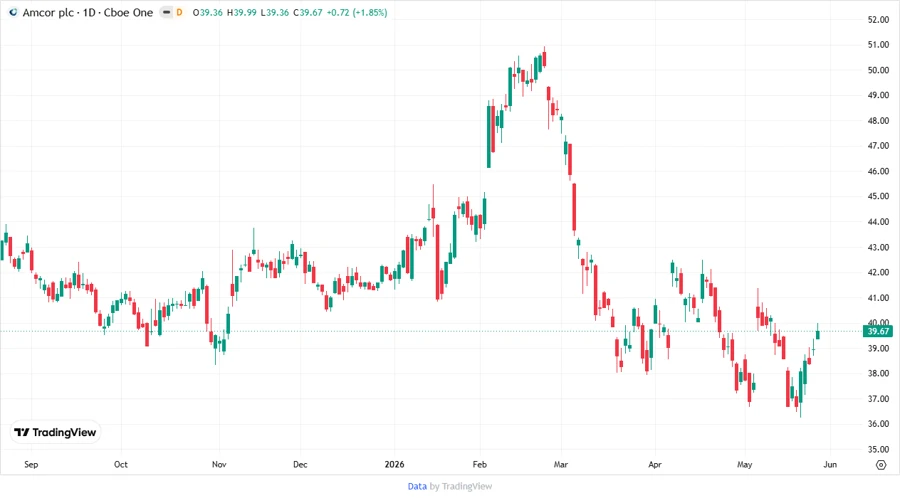
Price Development
Dividend Scoring System
| Criterion | Description | Score |
|---|---|---|
| Dividend yield | Attractive yield level | 4 |
| Dividend Stability | Consistent payment history | 4 |
| Dividend growth | Stable, moderate increases | 3 |
| Payout ratio | Requires monitoring | 2 |
| Financial stability | Leverage concerns | 2.5 |
| Dividend continuity | Long-term track record | 4.5 |
| Cashflow Coverage | Potential stress signals | 2.5 |
| Balance Sheet Quality | Mixed indicators | 3.5 |
Total Score: 25.5 / 40
🔍 Rating
Amcor plc presents a mixed dividend profile with attractive yield but overextended payout ratios. Though financially stable with reliable performance metrics, the company faces leverage challenges. As such, Amcor suits income-oriented investors seeking returns from a proven dividend-paying company while maintaining vigilance on cash flow sustainability and debt management.
Smart Data Insight
Master the Perfect Entry & Exit for this Stock
Don't leave your profits to chance. Historically, this stock follows specific seasonal patterns that institutional traders use to maximize returns.
- ✅ Identify the "Golden Buying Window"
- ✅ Avoid high-risk correction cycles
- ✅ Backtested data from the last 20+ years