January 20, 2026 a 07:47 am
AMCR: Dividend Analysis - Amcor plc
Amcor plc presents a strong dividend profile, featuring an attractive yield and a robust history of consistent payments over the past 12 years. Although there was a cut in 2015, the ongoing trajectory reflects a commitment to returning value to shareholders through dividends. Given the company's strategic positioning within the sector, its current financial health augurs well for sustained dividend payouts.
📊 Overview
Amcor plc operates within the packaging sector, showcasing a commendable dividend yield of 6.02%. The current dividend per share stands at $0.53, solidifying the company's stature with a 12-year dividend history. With the last cut occurring in 2015, investors witness strong reliability in Amcor's dividend distribution.
| Metric | Value |
|---|---|
| Sector | Packaging |
| Dividend yield | 6.02% |
| Current dividend per share | $0.53 |
| Dividend history | 12 years |
| Last cut or suspension | 2015 |
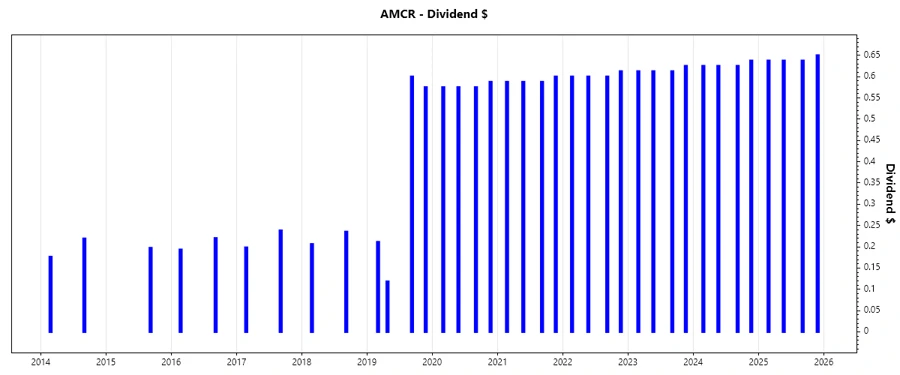
🗣️ Dividend History
Understanding Amcor's dividend history is crucial as it reflects the company's capacity to maintain consistent shareholder returns through various market cycles. The stability of past payments enhances investor confidence.
| Year | Dividend Per Share (USD) |
|---|---|
| 2025 | 2.5625 |
| 2024 | 2.5125 |
| 2023 | 2.4625 |
| 2022 | 2.4125 |
| 2021 | 2.3625 |
📈 Dividend Growth
Analyzing the dividend growth rates offers insights into the potential for future increases in shareholder returns. Amcor plc has demonstrated modest growth, with a 3-year rate of 2.03% and a 5-year rate of 2.07%.
| Time | Growth |
|---|---|
| 3 years | 2.03% |
| 5 years | 2.07% |
The average dividend growth is 2.07% over 5 years. This shows moderate but steady dividend growth.
⚠️ Payout Ratio
The payout ratio is vital in evaluating whether Amcor's dividend payments are sustainable long-term. A conservative EPS-based payout ratio of 29.04% and an FCF-based ratio of 16.23% signify strong dividend coverage.
| Key figure | Ratio |
|---|---|
| EPS-based | 29.04% |
| Free cash flow-based | 16.23% |
With a low payout ratio, Amcor confirms its capability to sustain and potentially heighten its dividend payouts, assuring dividend safety.
✅ Cashflow & Capital Efficiency
Amcor's capital efficiency and cash flow management practices play a pivotal role in maintaining shareholder returns while investing in growth. Key metrics over recent years depict a balanced approach.
| Metric | 2023 | 2024 | 2025 |
|---|---|---|---|
| Free Cash Flow Yield | 1.00% | 1.20% | 1.11% |
| Earnings Yield | 1.43% | 1.06% | 0.70% |
| CAPEX to Operating Cash Flow | 41.71% | 37.24% | 41.73% |
| Stock-based Compensation to Revenue | 0.37% | 0.23% | 0.49% |
| Free Cash Flow / Operating Cash Flow Ratio | 58.27% | 62.76% | 58.27% |
Stable cash flows and efficient capital allocation techniques highlight Amcor's robust financial health, assuring investors of sustained profitability prospects.
📉 Balance Sheet & Leverage Analysis
Amcor plc's balance sheet and leverage ratios provide valuable insights into the overall financial health, emphasizing a manageable debt load and efficient capital management.
| Metric | 2023 | 2024 | 2025 |
|---|---|---|---|
| Debt-to-Equity | 1.79 | 1.85 | 1.28 |
| Debt-to-Assets | 0.42 | 0.43 | 0.40 |
| Debt-to-Capital | 0.64 | 0.65 | 0.56 |
| Net Debt to EBITDA | 3.06 | 3.57 | 6.94 |
| Current Ratio | 1.19 | 1.17 | 1.21 |
| Quick Ratio | 0.69 | 0.69 | 0.71 |
| Financial Leverage | 4.22 | 4.26 | 3.16 |
Amcor's moderate leverage with a solid current ratio accentuates its strong liquidity position, reinforcing its ability to meet short-term obligations and sustain growth investments.
📊 Fundamental Strength & Profitability
Analyzing foundational financial strengths unveils Amcor's exemplary management of resources and consequent profitability, key to long-term growth and shareholder value.
| Metric | 2023 | 2024 | 2025 |
|---|---|---|---|
| Return on Equity | 26.03% | 18.81% | 4.36% |
| Return on Assets | 6.16% | 4.42% | 1.38% |
| Margins: Net | 7.13% | 5.35% | 3.40% |
| EBIT | 10.49% | 9.20% | 6.97% |
| EBITDA | 14.48% | 13.56% | 11.78% |
| Gross | 18.54% | 19.88% | 18.88% |
| Research & Development to Revenue | 0.69% | 0.78% | 0.80% |
Amcor displays strong financial resiliency with significant return ratios and profit margins, distinctly marking its ability to convert revenue streams into equity growth and net profit.
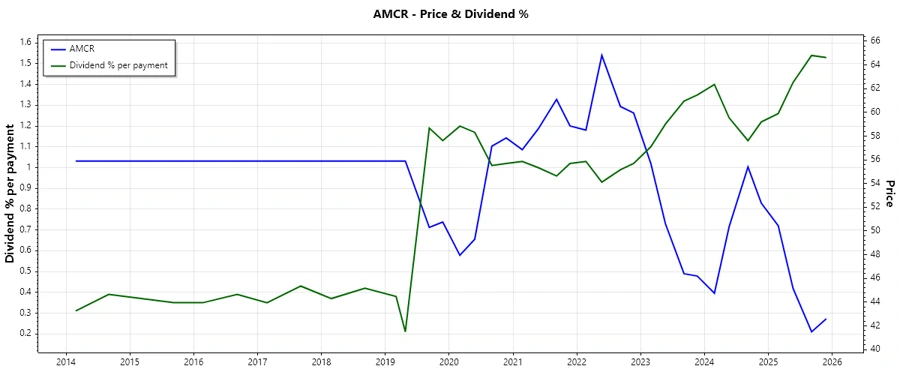
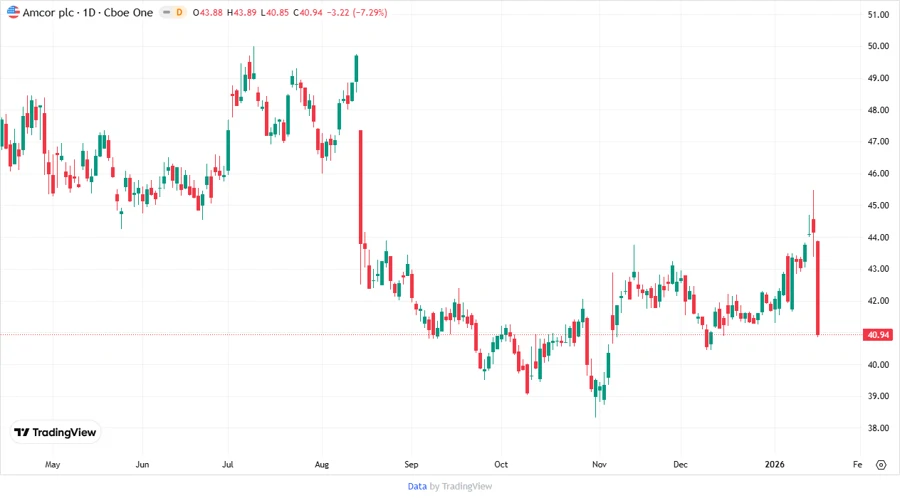
📈 Price Development
🏆 Dividend Scoring System
| Criteria | Score | Score Bar |
|---|---|---|
| Dividend yield | 5 | |
| Dividend Stability | 4 | |
| Dividend growth | 3 | |
| Payout ratio | 5 | |
| Financial stability | 4 | |
| Dividend continuity | 4 | |
| Cashflow Coverage | 4 | |
| Balance Sheet Quality | 3 |
Total Score: 32 out of 40
📊 Rating
Amcor plc exhibits a strong dividend profile with a competitive yield and reliable dividend payments. While dividend growth could be enhanced, the current financial metrics suggest robustness in sustaining future dividends. This stable outlook makes Amcor an attractive opportunity for income-focused portfolios, endorsing it as a strong "Buy".