October 02, 2025 a 01:16 pm
AMAT: Trend and Support & Resistance Analysis - Applied Materials, Inc.
Applied Materials (AMAT) has shown remarkable price movements in recent months with a significant impact on the semiconductor industry. As a leading provider of manufacturing equipment, services, and software, AMAT's stock performance is closely watched by investors. Our analysis focuses on identifying trends and key support & resistance levels from the historical data provided. With fluctuations in the semiconductor market, understanding the stock's trends offers insights for potential future movements.
Trend Analysis
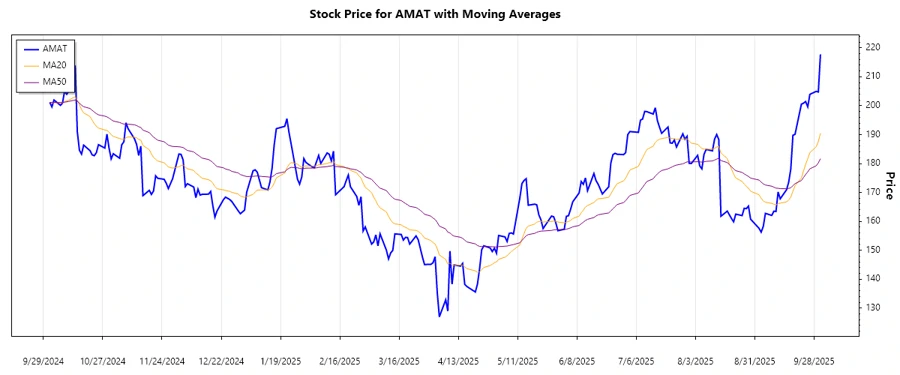
The analysis of the last several trading months reveals key insights into the price movements of AMAT. Using the Exponential Moving Averages (EMA), we examine short-term and long-term trends. By calculating the EMA20 and EMA50 from the closing prices, we can interpret recent trends in the stock's behavior:
| Date | Close Price | Trend |
|---|---|---|
| 2025-10-01 | $217.74 | ▲ Uptrend |
| 2025-09-30 | $204.74 | ▲ Uptrend |
| 2025-09-29 | $204.95 | ▲ Uptrend |
| 2025-09-26 | $203.92 | ▲ Uptrend |
| 2025-09-25 | $199.60 | ▲ Uptrend |
| 2025-09-24 | $201.44 | ▲ Uptrend |
| 2025-09-23 | $200.87 | ▲ Uptrend |
The EMA comparison indicates a persistent upward trend in AMAT, with the EMA20 consistently above the EMA50. This suggests a bullish momentum in the market.
Support and Resistance
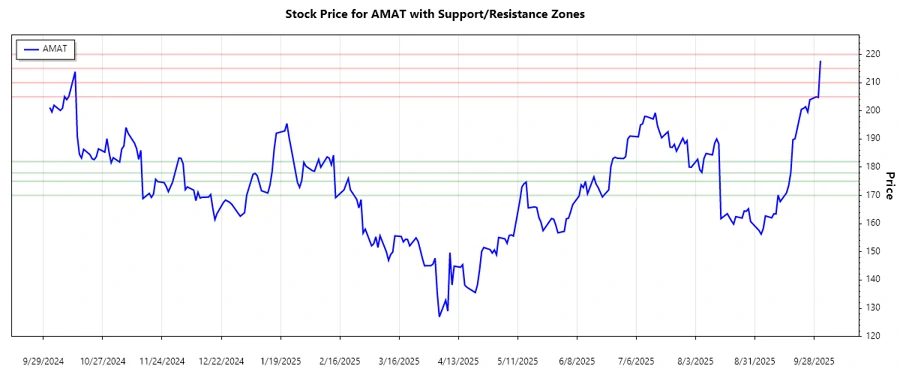
Analyzing the historical prices lets us identify critical support and resistance levels. These levels help understand where the stock might pause or reverse:
| Zone Type | From | To |
|---|---|---|
| Support | $170.00 | $175.00 |
| Support | $178.00 | $182.00 |
| Resistance | $205.00 | $210.00 |
| Resistance | $215.00 | $220.00 |
The current price falls within the $215.00 - $220.00 resistance zone. If it breaks through, it could lead to a further bullish movement.
These zones act as psychological levels influencing trading decisions, with the current upward momentum challenging resistance levels.
Conclusion
Applied Materials shows a strong upward trend with its EMA20 remaining above EMA50. This bullish sentiment reflects investor confidence in the company’s performance, particularly within the semiconductor sector. The stock currently tests a significant resistance zone, and a breakout could propel it higher. However, should it fail to hold its ground above this level, a retreat to established support zones is likely. Investors might consider these technical levels alongside fundamental analyses to inform their decisions, balancing the potential for upward movement against inherent market risks.
Smart Data Insight
Master the Perfect Entry & Exit for this Stock
Don't leave your profits to chance. Historically, this stock follows specific seasonal patterns that institutional traders use to maximize returns.
- ✅ Identify the "Golden Buying Window"
- ✅ Avoid high-risk correction cycles
- ✅ Backtested data from the last 20+ years