
May 30, 2026 a 07:43 pm
AMAT: Fundamental Ratio Analysis - Applied Materials, Inc.
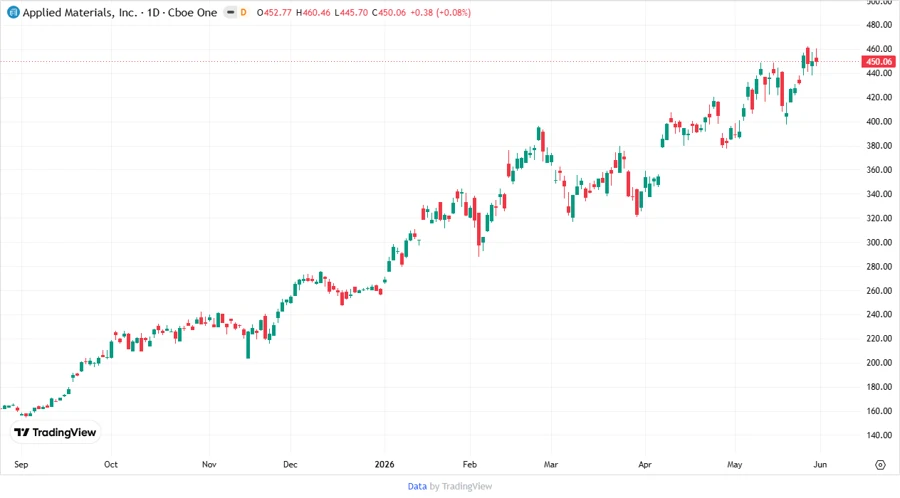
Applied Materials, Inc. (AMAT) operates in the technology sector with a broad industry presence, known for its innovations in semiconductor systems. Despite market fluctuations, the company's strategic focus on high-growth segments offers promising prospects.
Fundamental Rating
The fundamental rating for Applied Materials shows a stable performance, reflecting strengths and areas for potential improvement.
| Category | Score | Visualization |
|---|---|---|
| Discounted Cash Flow | 3 | |
| Return on Equity | 5 | |
| Return on Assets | 5 | |
| Debt to Equity | 2 | |
| Price to Earnings | 2 | |
| Price to Book | 1 |
Historical Rating
The historical data reflect the company's ability to maintain consistent scores over time.
| Date | Overall | DCF | ROE | ROA | D/E | P/E | P/B |
|---|---|---|---|---|---|---|---|
| 2026-05-28 | 3 | 3 | 5 | 5 | 2 | 2 | 1 |
| Previous | 0 | 3 | 5 | 5 | 2 | 2 | 1 |
Analyst Price Targets
Analysts estimate a range in price targets, indicating both confidence and diversity in expectations.
| High | Low | Median | Consensus |
|---|---|---|---|
| 575 | 425 | 520 | 518.36 |
Analyst Sentiment
Overall, analysts maintain a positive sentiment towards AMAT, with strong buy and buy ratings dominating.
| Recommendation | Count | Distribution |
|---|---|---|
| Strong Buy | 1 | |
| Buy | 40 | |
| Hold | 12 | |
| Sell | 0 | |
| Strong Sell | 0 |
Conclusion
Applied Materials continues to demonstrate strong fundamentals, particularly in return metrics, despite moderate concerns over debt levels. The company's growth prospects, as reflected by consistent analyst ratings and favorable price targets, indicate a robust future outlook. However, potential market volatility and technological disruptions remain as external risks. A balanced investment approach considering these factors can yield favorable results for stakeholders.
Smart Data Insight
Master the Perfect Entry & Exit for this Stock
Don't leave your profits to chance. Historically, this stock follows specific seasonal patterns that institutional traders use to maximize returns.
- ✅ Identify the "Golden Buying Window"
- ✅ Avoid high-risk correction cycles
- ✅ Backtested data from the last 20+ years