April 09, 2026 a 04:44 pm
AMAT: Fibonacci Analysis - Applied Materials, Inc.
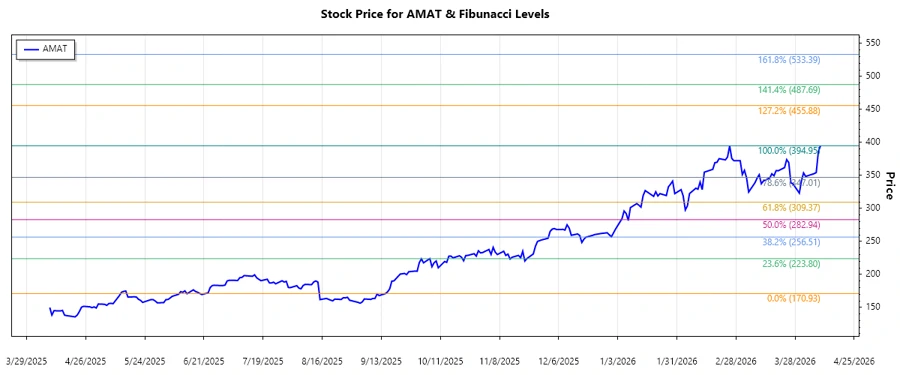
Applied Materials, Inc. has shown significant growth, with the company's equipment and software catering to the ever-growing semiconductor industry. The recent price action suggests a robust uptrend, reflecting strong market confidence. This analysis examines the potential areas of support and resistance using Fibonacci retracement levels to anticipate future price movements.
Fibonacci Analysis
| Detail | Value |
|---|---|
| Trend Start Date | 2025-11-19 |
| Trend End Date | 2026-04-09 |
| High Point | 394.95 on 2026-02-25 |
| Low Point | 170.93 on 2025-09-15 |
| Fibonacci Levels (0.236) | 280.74 |
| Fibonacci Levels (0.382) | 318.16 |
| Fibonacci Levels (0.5) | 332.94 |
| Fibonacci Levels (0.618) | 347.72 |
| Fibonacci Levels (0.786) | 371.93 |
| Current Price | 394.85 |
| Retracement Zone | None |
| Interpretation | The price is above the highest Fibonacci level, indicating a continuation of the upward momentum. |
Conclusion
Applied Materials, Inc. continues to prosper in the expanding semiconductor industry, reflected in its robust stock performance. The stock price is currently trading above the Fibonacci retracement levels, indicating investor confidence and the potential for continued growth. However, the market's inherent volatility necessitates caution, with eyes on potential corrections. Traders and analysts should watch for signs of price consolidation or a breakthrough to new highs to validate further movements. Overall, Applied Materials presents opportunities but demands vigilant monitoring.