June 15, 2026 a 02:46 am


AMAT: Dividend Analysis - Applied Materials, Inc.
Applied Materials, Inc. demonstrates a modest dividend yield at 0.35%, reflecting its strategic investment for growth rather than immediate high yield returns. Despite this low yield, the company shows resilience with 22 years of dividend history without suspension, indicating reliability. The anticipated steady dividend growth suggests a long-term commitment to shareholder returns.
📊 Overview
The overview of Applied Materials, Inc.'s dividend provides insight into the company's commitment to returning value to Shareholders. The consistent history and prudent payout ratios reflect a financially disciplined approach.
| Metric | Value |
|---|---|
| Sector | Technology |
| Dividend yield | 0.35% |
| Current dividend per share | 1.72 USD |
| Dividend history | 22 years |
| Last cut or suspension | None |
🗣️ Dividend History
Analyzing the dividend history provides a lens into the company's strategic financial management and reliability to shareholders. Stability and growth of dividends over time are crucial for long-term investors focusing on income.
| Year | Dividend per Share (USD) |
|---|---|
| 2026 | 1.52 |
| 2025 | 1.78 |
| 2024 | 1.52 |
| 2023 | 1.22 |
| 2022 | 1.02 |
📈 Dividend Growth
The dividend growth rate over time is a significant factor for investors focusing on dividend income growth. A steady increase in dividends can indicate a company's growing cash flow and commitment to returning value to shareholders.
| Time | Growth |
|---|---|
| 3 years | 20.39% |
| 5 years | 15.39% |
The average dividend growth is 15.39% over 5 years. This shows moderate but steady dividend growth.
✅ Payout Ratio
The payout ratio reflects the proportion of earnings paid to shareholders in dividends. A sustainable payout ratio is crucial as it indicates that the company retains enough earnings to reinvest into its operations.
| Key figure | Ratio |
|---|---|
| EPS-based | 16.06% |
| Free cash flow-based | 22.91% |
The low payout ratios of 16.06% (EPS) and 22.91% (FCF) suggest a strong capacity to sustain and possibly increase dividend payments while maintaining significant earnings for growth.
Cashflow & Capital Efficiency
The efficiency in capital allocation and stability of cash flows are vital to sustaining dividend payments. Healthy cash generation ensures sufficient coverage of dividends and operational maneuverability.
| Metric | 2023 | 2024 | 2025 |
|---|---|---|---|
| Free Cash Flow Yield | 6.89% | 4.88% | 3.06% |
| Earnings Yield | 6.23% | 4.68% | 3.76% |
| CAPEX to Operating Cash Flow | 12.71% | 13.71% | 28.39% |
| Stock-based Compensation to Revenue | 1.85% | 2.12% | 2.30% |
| Free Cash Flow / Operating Cash Flow Ratio | 87.29% | 86.29% | 71.60% |
The positive cash flow yields and disciplined capital expenditures signify strong operational cash management and investment in growth areas, contributing to sustainable and scalable financial health.
Balance Sheet & Leverage Analysis
A robust balance sheet is foundational for financial health, and effective leverage management ensures optimal use of debt to finance growth while mitigating financial risk.
| Metric | 2023 | 2024 | 2025 |
|---|---|---|---|
| Debt-to-Equity | 36.69% | 34.76% | 34.53% |
| Debt-to-Assets | 19.52% | 19.20% | 19.42% |
| Debt-to-Capital | 26.84% | 25.79% | 25.67% |
| Net Debt to EBITDA | -1.57% | -16.12% | -1.98% |
| Current Ratio | 2.60 | 2.51 | 2.61 |
| Quick Ratio | 1.82 | 1.87 | 1.87 |
| Financial Leverage | 1.88 | 1.81 | 1.78 |
The financial figures suggest commendable financial stability with considerable liquidity and controlled debt levels, contributing to resilience against economic fluctuations.
Fundamental Strength & Profitability
Assessing fundamental strength through profitability metrics and investment in research allows investors to understand operational efficiency and strategic positioning in the market.
| Metric | 2023 | 2024 | 2025 |
|---|---|---|---|
| Return on Equity | 41.94% | 37.77% | 34.28% |
| Return on Assets | 22.31% | 20.86% | 19.28% |
| Margins: Net | 25.86% | 26.41% | 24.67% |
| Margins: EBIT | 29.99% | 30.91% | 33.63% |
| Margins: EBITDA | 31.89% | 32.35% | 34.02% |
| Margins: Gross | 46.70% | 47.46% | 48.67% |
| Research & Development to Revenue | 11.70% | 11.90% | 12.58% |
The strong ROE and ROA alongside healthy profitability margins underpin Applied Materials' operational efficiency and ability to leverage its competitive strengths through research and innovation.
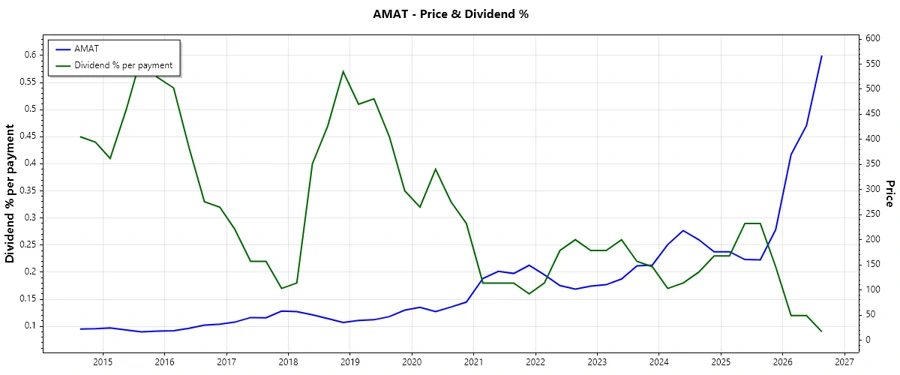
📉 Price Development
Dividend Scoring System
| Category | Score (1-5) | Score Bar |
|---|---|---|
| Dividend yield | 2 | |
| Dividend Stability | 4 | |
| Dividend growth | 3 | |
| Payout ratio | 5 | |
| Financial stability | 4 | |
| Dividend continuity | 5 | |
| Cashflow Coverage | 4 | |
| Balance Sheet Quality | 5 |
Overall Score: 32/40
Rating
Applied Materials, Inc. has a robust dividend policy underpinned by strong financials and disciplined cash management. While the current yield may not be enticing for short-term income investors, the sustained growth, financial prudence, and strategic reinvestment into the business build a solid foundation for long-term shareholder wealth generation. Recommended for investors seeking stable dividend growth with a track record of consistency.
Smart Data Insight
Master the Perfect Entry & Exit for this Stock
Don't leave your profits to chance. Historically, this stock follows specific seasonal patterns that institutional traders use to maximize returns.
- ✅ Identify the "Golden Buying Window"
- ✅ Avoid high-risk correction cycles
- ✅ Backtested data from the last 20+ years