
July 11, 2026 a 09:03 am
ALL: Trend and Support & Resistance Analysis - The Allstate Corporation
The Allstate Corporation, with its diverse insurance offerings, remains a significant player in the insurance sector. Analyzing the trend and support/resistance levels of its stock can guide investors on its future price movements. The stock recently has shown a dominant trend that investors should carefully monitor to align their positions strategically.
Trend Analysis
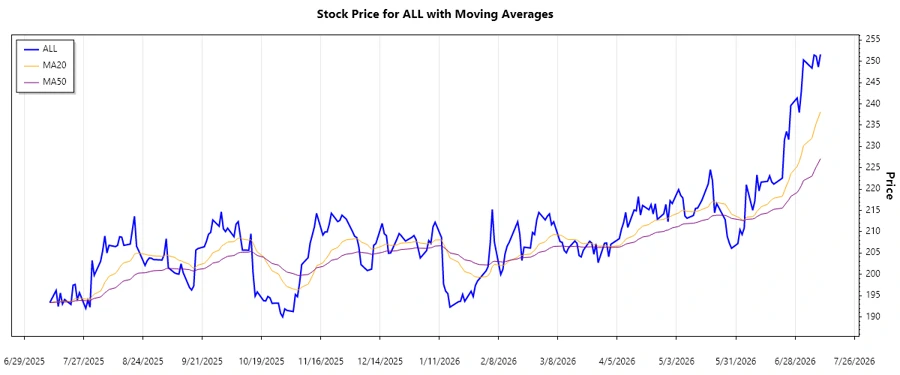
The daily closing prices for The Allstate Corporation have been analyzed for the last several months. Calculating EMA20 and EMA50, the stock presents a consistent upward movement. Recent data shows EMA20 crossing above EMA50, indicating a ▲ strong uptrend.
| Date | Closing Price | Trend |
|---|---|---|
| 2026-07-10 | $251.61 | ▲ Uptrend |
| 2026-07-09 | $248.64 | ▲ Uptrend |
| 2026-07-08 | $251.17 | ▲ Uptrend |
| 2026-07-07 | $251.46 | ▲ Uptrend |
| 2026-07-06 | $248.37 | ▲ Uptrend |
| 2026-07-02 | $250.33 | ▲ Uptrend |
| 2026-07-01 | $243.12 | ▲ Uptrend |
Technically, the strong uptrend suggests further potential growth assuming external market conditions remain favorable.
Support- and Resistance
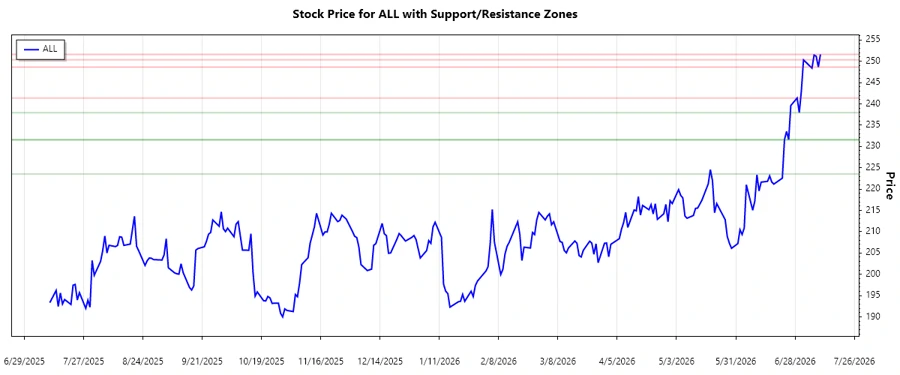
Identifying the critical support and resistance zones is crucial for understanding potential price reversals or continuations. Recent analysis highlights the following zones:
| Zone Type | From | To |
|---|---|---|
| Support 1 | $231.60 | $237.94 |
| Support 2 | $223.55 | $231.54 |
| Resistance 1 | $250.33 | $251.61 |
| Resistance 2 | $241.38 | $248.64 |
The current price is hovering around resistance zones which may cause a temporary pause or reversal in the price trend. Technical indicators suggest monitoring these levels closely.
Conclusion
The Allstate Corporation's stock has recently experienced a strong upward trend, supported by increasing investor confidence and positive market sentiments. Despite potential resistance near current levels, the broader trend suggests optimism for future growth. Investors should maintain a vigilant watch over key technical zones and be prepared for potential pullbacks or breakthroughs. A focus on broader market conditions and company-specific developments will provide further insights into its trajectory. Overall, while the trend is promising, cautious optimism should guide investment decisions.
Smart Data Insight
Master the Perfect Entry & Exit for this Stock
Don't leave your profits to chance. Historically, this stock follows specific seasonal patterns that institutional traders use to maximize returns.
- ✅ Identify the "Golden Buying Window"
- ✅ Avoid high-risk correction cycles
- ✅ Backtested data from the last 20+ years