February 12, 2026 a 11:44 am
ALL: Fibunacci Analysis - The Allstate Corporation
The Allstate Corporation, with its strong presence in the property and casualty insurance sector, has shown resilience in its financial performance. The stock has experienced notable price fluctuations in recent months. With evolving market dynamics, there's potential for upside if macroeconomic conditions stabilize. Investors are advised to keep an eye on industry trends and regulatory changes that may impact the insurance sector.
Fibunacci Analysis
| Details | Information |
|---|---|
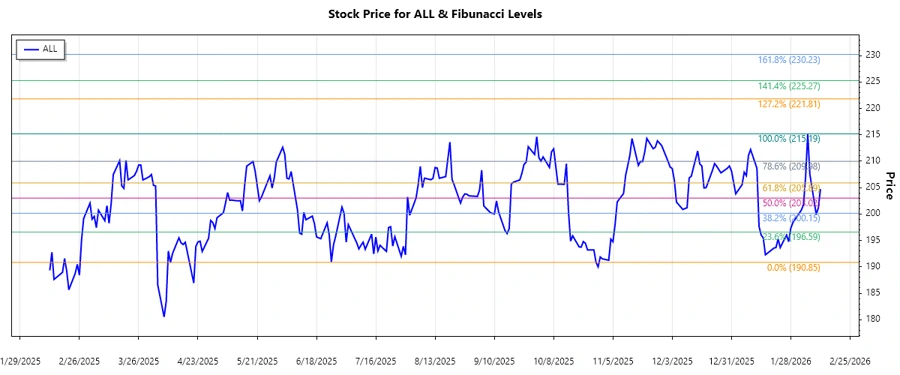
| Trend Period | December 11, 2025 - February 5, 2026 |
| High Point | $215.19 on February 5, 2026 |
| Low Point | $190.85 on October 28, 2025 |
Fibonacci Levels
| Level | Price |
|---|---|
| 0.236 | $204.94 |
| 0.382 | $202.11 |
| 0.5 | $198.02 |
| 0.618 | $195.92 |
| 0.786 | $192.79 |
With the current price at approximately $204.73, The Allstate Corporation is trading between the 0.236 and 0.382 retracement levels. This indicates that the stock is currently in the beginning stages of a potential retracement. Investors should be cautious, looking for signs of a support level forming around these zones.
Technical interpretation suggests that should support develop around the 0.236 or 0.382 level, it may present a buying opportunity, while a drop below the 0.5 level may indicate further weakness.
Conclusion
The Allstate Corporation is currently undergoing a period of price correction after a significant rise. The proximity to the 0.236 retracement level provides an opportunity for long-term investors to consider entry points, should the stock show stability. However, caution is advised due to potential volatility in the insurance industry, driven by regulatory changes and market conditions. It is crucial to keep a close watch on earnings reports and economic indicators that might impact profitability and stock performance. A balanced investment strategy considering potential risks and market trends is recommended.