January 19, 2026 a 04:44 pm
ALL: Fibonacci Analysis - The Allstate Corporation
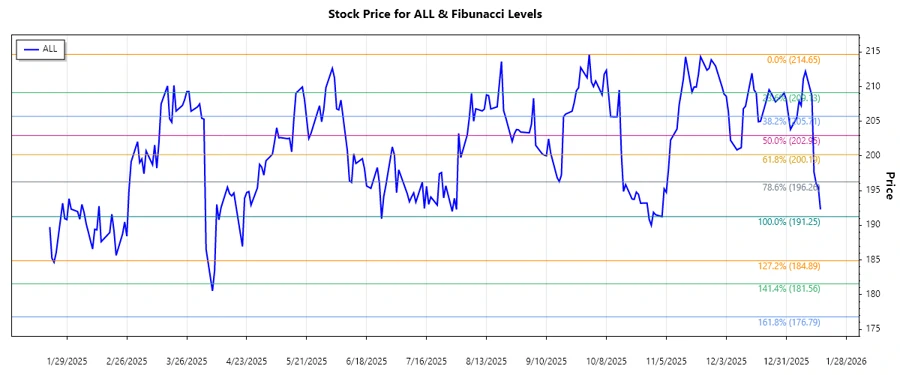
The Allstate Corporation (Ticker: ALL), a prominent player in the insurance sector, has shown fluctuations in its stock prices over the past months. The technical analysis of its stock reveals a significant trend that can be utilized for further insights. Applying Fibonacci retracement levels to the latest identified trend helps in predicting potential areas of support and resistance, crucial for future trading strategies.
Fibonacci Analysis
The recent historical price data for The Allstate Corporation shows a dominant downward trend. By analyzing the maximum and minimum price points within this timeframe, key Fibonacci retracement levels have been calculated.
| Factor | Price |
|---|---|
| Start Date | 2025-06-02 |
| End Date | 2026-01-16 |
| High Point | $214.65 (2025-09-30) |
| Low Point | $191.25 (2025-11-03) |
| Fibonacci Level | Level (%) | Price |
|---|---|---|
| 0.236 | 23.6% | $196.23 |
| 0.382 | 38.2% | $199.72 |
| 0.500 | 50.0% | $202.95 |
| 0.618 | 61.8% | $206.17 |
| 0.786 | 78.6% | $211.07 |
As of the latest close, the current stock price is $192.28, situating it just above the low point but not within a notable Fibonacci retracement zone. This current positioning suggests caution as the stock remains bearish but could potentially test the lower retracement levels as support.
Conclusion
The Allstate Corporation's stock has experienced a downward trend within the analyzed period, with potential recovery indicators at critical Fibonacci levels. Although the current price is not within the primary retracement zones, keeping a watchful eye on movements toward these levels could reveal new support regions or a foundation for reversal. Investors should weigh the risks of potential downward pressure against the opportunity of stabilization and uptrend amidst market conditions.