November 23, 2025 a 11:44 am

ALL: Fibonacci Analysis - The Allstate Corporation
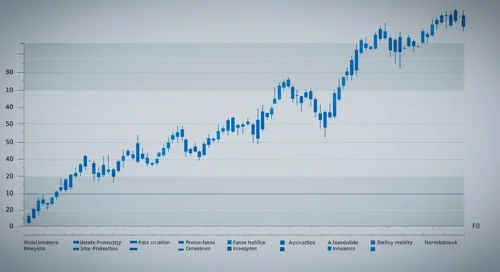
Allstate Corporation's stock has been experiencing an overall upward trend over the last several months. This trend reflects the company's solid financial performance and productive strategic segments, ranging from auto and home insurance to identity protection services. As the U.S. and Canadian markets continue to adapt and grow, Allstate is poised to leverage its broad range of protection plans to create value for shareholders.
Fibonacci Analysis
| Metric | Details |
|---|---|
| Start Date | 2024-12-05 |
| End Date | 2025-11-21 |
| High Point | $214.65 on 2025-09-30 |
| Low Point | $180.53 on 2025-04-07 |
| Fibonacci Level | Price |
|---|---|
| 0.236 | $193.00 |
| 0.382 | $198.62 |
| 0.5 | $202.59 |
| 0.618 | $206.56 |
| 0.786 | $211.75 |
The current price of $214.32 is above the 0.786 Fibonacci level, indicating it is in an extension beyond traditional retracement zones. This suggests strong investor sentiment and potential support above the 0.786 level.
Conclusion
Allstate's stock showcases a robust upward trend, supported by strong operational segments and a diverse set of products that appeal to varying consumer needs. The current position above the Fibonacci levels suggests momentum in the market, with potential support levels being tested positively. Analysts should watch for sustained economic growth and the insurance industry's evolution, as these factors will heavily influence future stock performance. Risk factors include increased competition and regulatory changes that could impact growth. However, provided the current trajectory continues, Allstate remains an attractive proposition for investors seeking stability in the insurance sector.
Smart Data Insight
Master the Perfect Entry & Exit for this Stock
Don't leave your profits to chance. Historically, this stock follows specific seasonal patterns that institutional traders use to maximize returns.
- ✅ Identify the "Golden Buying Window"
- ✅ Avoid high-risk correction cycles
- ✅ Backtested data from the last 20+ years