September 27, 2025 a 09:03 am
ALLE: Trend and Support & Resistance Analysis - Allegion plc
The Allegion plc stock has been showing positive momentum over the past months, with a recent upward trend indicating bullish investor sentiment. As a key player in the security solutions market, Allegion's expansion into electronic security products has likely contributed to the recent price increases. However, the stock remains volatile, and investors need to watch key support and resistance levels closely. The current analysis aims to provide insights into the potential trends and pivotal price zones. This will help investors make informed decisions regarding Allegion's stock performance.
Trend Analysis
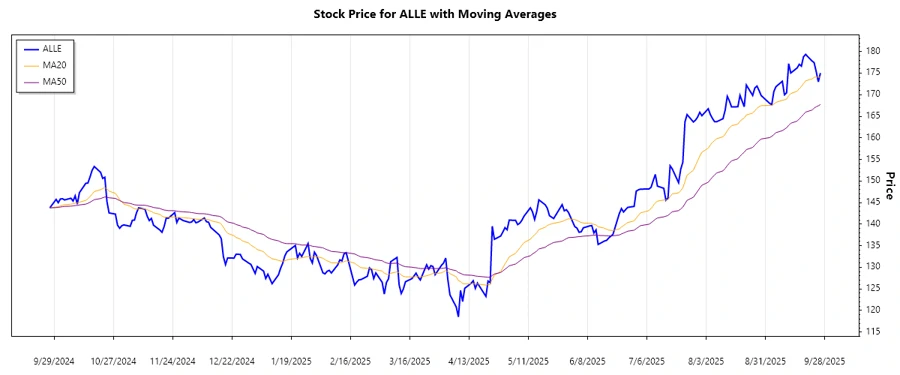
The analysis of Allegion's stock data highlights a predominately upward trend, as indicated by a consistent increase in closing prices over the span of several months. This analysis is supported by an evaluation of Exponential Moving Averages (EMAs), particularly the EMA20 and EMA50.
| Date | Closing Price | Trend |
|---|---|---|
| 2025-09-26 | $175.01 | ▲ Upward |
| 2025-09-25 | $172.97 | ▼ Downward |
| 2025-09-24 | $175.34 | ▲ Upward |
| 2025-09-23 | $177.44 | ▲ Upward |
| 2025-09-22 | $177.81 | ▲ Upward |
| 2025-09-19 | $179.33 | ▲ Upward |
| 2025-09-18 | $178.78 | ▼ Downward |
The EMA20 is currently above the EMA50, signifying a sustained upward trend. The upward trajectory indicates potential continued growth in stock price.
Support- and Resistance
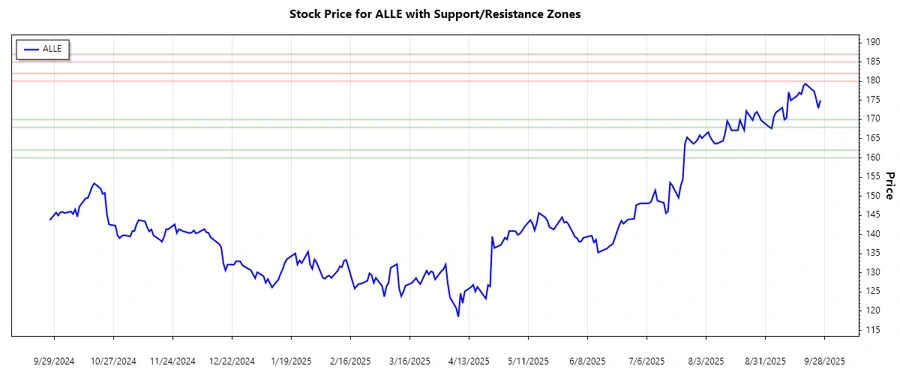
An evaluation of Allegion's trading data presents two primary support and resistance zones derived from recent price patterns.
| Zone Type | From | To |
|---|---|---|
| Support Zone 1 | $168 | $170 |
| Support Zone 2 | $160 | $162 |
| Resistance Zone 1 | $180 | $182 |
| Resistance Zone 2 | $185 | $187 |
The current price is close to touching the lower end of Resistance Zone 1, suggesting a possible challenge in breaking above this zone without strong momentum.
The importance of monitoring these zones is crucial as they serve as key levels where the stock price may reverse or break out significantly.
Conclusion
Allegion plc's stock presents opportunities for investors seeking growth in the security solutions market. With a clear upward trend as indicated by EMA patterns and current price dynamics, there is a potential for continued appreciation in the near term. However, price levels at resistance zones represent significant hurdles that must be overcome for further gains. Additionally, the identification of crucial support zones ensures potential downside risks can be managed effectively. Strategic observation of these indicators will equip analysts and investors to optimize entry and exit points, capitalizing on market shifts effectively.
Smart Data Insight
Master the Perfect Entry & Exit for this Stock
Don't leave your profits to chance. Historically, this stock follows specific seasonal patterns that institutional traders use to maximize returns.
- ✅ Identify the "Golden Buying Window"
- ✅ Avoid high-risk correction cycles
- ✅ Backtested data from the last 20+ years