February 11, 2026 a 02:46 am
ALLE: Dividend Analysis - Allegion plc
Allegion plc, known for its reliability in dividend payouts, offers a modest dividend yield with consistent growth over the years. With a strong payout history and a sound financial position, Allegion presents itself as a stable dividend player in the market. However, the slightly lower yield demands consideration in comparison to its sector peers.
📊 Overview
Allegion plc operates within the security solutions sector, offering a variety of access control systems. Its dividend profile is characterized by a conservative yield at 1.16%. The firm has maintained dividends consistently over the past 13 years without any recent cut or suspension, highlighting its commitment to returning value to shareholders.
| Key Data | Value |
|---|---|
| Sector | Security Solutions |
| Dividend yield | 1.16% |
| Current dividend per share | 1.92 USD |
| Dividend history | 13 years |
| Last cut or suspension | None |
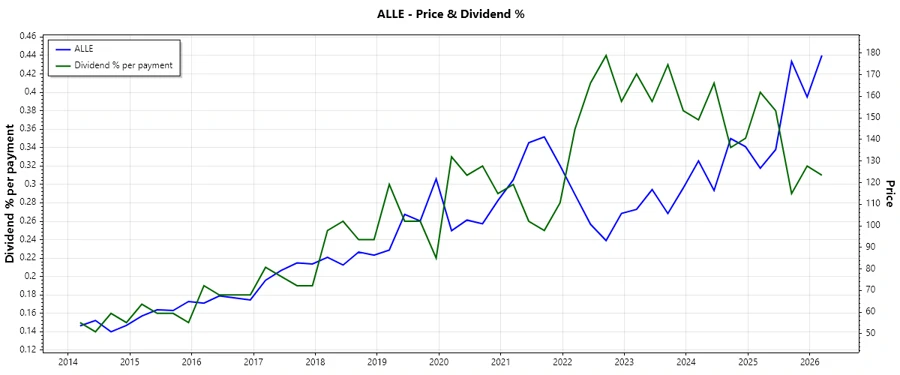
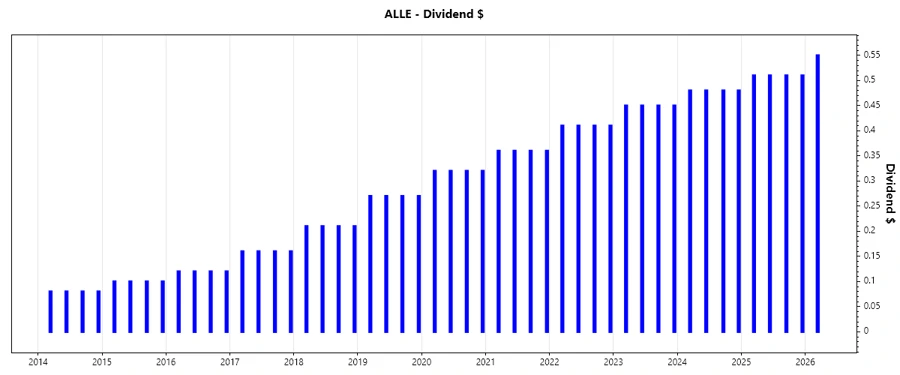
🗣️ Dividend History
Allegion's dividend history reflects its robust financial health and strategic approach toward shareholder return. Over the years, the company has shown a steady increase in dividend payouts, reinforcing confidence for long-term investors. This consistency is a testament to its operational stability and sound fiscal management.
| Year | Dividend Per Share (USD) |
|---|---|
| 2026 | 0.55 |
| 2025 | 2.04 |
| 2024 | 1.92 |
| 2023 | 1.80 |
| 2022 | 1.64 |
📈 Dividend Growth
The company's trajectory in dividend growth indicates a prudent increment over both the 3-year and 5-year periods. This growth is an encouraging signal for potential investors looking for both stability and appreciation in income.
| Time | Growth |
|---|---|
| 3 years | 7.55% |
| 5 years | 9.77% |
The average dividend growth is 9.77% over 5 years. This shows moderate but steady dividend growth, positioning the company as a reliable income provider.
⚠️ Payout Ratio
An analysis of payout ratios provides insight into the sustainability of dividends. Allegion's EPS payout ratio stands at 25.69% while its free cash flow payout ratio is 23.46%. These figures suggest that the dividends are well-covered by earnings and cash flow, indicative of a low-risk profile for dividend sustainability.
| Key figure | Ratio |
|---|---|
| EPS-based | 25.69% |
| Free cash flow-based | 23.46% |
These payout ratios highlight a conservative approach, aligning with the strategic objective of maintaining and gradually increasing dividend payments without encroaching on financial flexibility or operational capital.
📊 Cashflow & Capital Efficiency
The examination of cash flow and capital efficiency metrics is crucial for evaluating Allegion's financial robustness. Metrics such as free cash flow yield and CAPEX to operating cash flow ratio indicate effective capital utilization strategies.
| Metric | 2024 | 2023 | 2022 |
|---|---|---|---|
| Free Cash Flow Yield | 5.12% | 4.64% | 4.27% |
| Earnings Yield | 5.24% | 4.85% | 4.94% |
| CAPEX to Operating Cash Flow | 13.64% | 14.02% | 13.93% |
| Stock-based Compensation to Revenue | 0.75% | 0.72% | 0.75% |
| Free Cash Flow / Operating Cash Flow Ratio | 86.36% | 85.98% | 86.07% |
Allegion demonstrates robust cash flow management, ensuring sufficient liquidity for investments and other capital expenditures, while simultaneously supporting its dividend payment commitments efficiently.
📉 Balance Sheet & Leverage Analysis
Scrutinizing Allegion's balance sheet and leverage reveals its capability to sustain operations and meet financial obligations. Indicators like debt ratios and liquidity measures provide a comprehensive view of its financial health.
| Metric | 2024 | 2023 | 2022 |
|---|---|---|---|
| Debt-to-Equity | 1.43 | 1.53 | 2.22 |
| Debt-to-Assets | 0.48 | 0.47 | 0.52 |
| Debt-to-Capital | 0.59 | 0.60 | 0.69 |
| Net Debt to EBITDA | 1.80 | 1.88 | 2.62 |
| Current Ratio | 2.04 | 1.26 | 1.73 |
| Quick Ratio | 1.43 | 0.85 | 1.05 |
| Financial Leverage | 3.00 | 3.27 | 4.24 |
The analysis underscores a significant improvement in leverage positions, as well as effective management of resources to maintain liquidity, notably enhancing their financial stability and resilience against economic shifts.
✅ Fundamental Strength & Profitability
A robust analysis of profitability metrics and fundamental strength illustrates Allegion's operational efficiency and competitive positioning within its industry.
| Metric | 2024 | 2023 | 2022 |
|---|---|---|---|
| Return on Equity | 39.81% | 40.99% | 48.63% |
| Return on Assets | 13.31% | 12.53% | 11.48% |
| Margins: Net | 15.84% | 14.80% | 13.99% |
| Margins: EBIT | 21.23% | 19.46% | 18.04% |
| Margins: EBITDA | 24.31% | 22.51% | 21.04% |
Allegion's metrics highlight its proficient capital use and superior profitability indicators, underpinned by a calculated growth strategy that continues to yield positive outcomes.
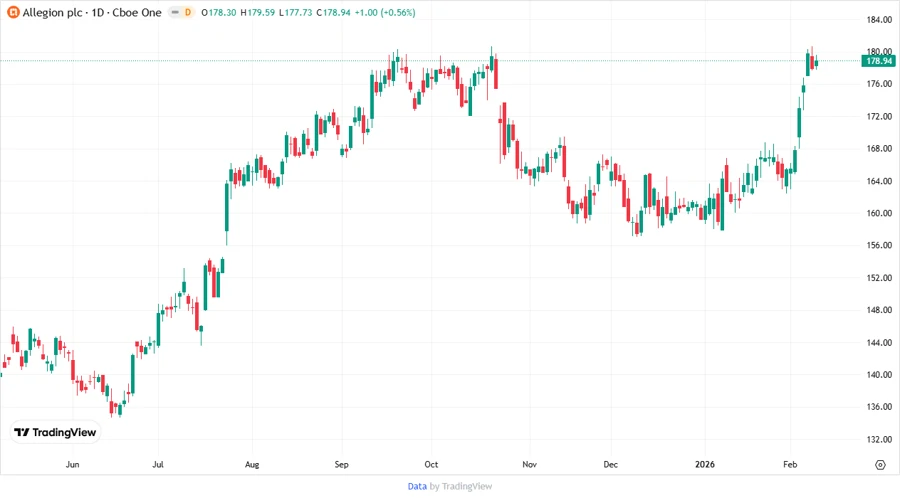
📈 Price Development
🎯 Dividend Scoring System
| Criterion | Score | Bar |
|---|---|---|
| Dividend yield | 3 | |
| Dividend Stability | 5 | |
| Dividend growth | 4 | |
| Payout ratio | 5 | |
| Financial stability | 4 | |
| Dividend continuity | 5 | |
| Cashflow Coverage | 4 | |
| Balance Sheet Quality | 4 |
Overall Score: 34/40
🔍 Rating
In conclusion, Allegion plc stands out as a solid dividend-paying entity, with its strong payout ratios and stable financial metrics. Its conservative growth and solid balance sheet make it a reliable choice for income-focused investors. While the yield is moderate, the company's operational excellence and financial resilience offer a compelling long-term prospect.
Smart Data Insight
Master the Perfect Entry & Exit for this Stock
Don't leave your profits to chance. Historically, this stock follows specific seasonal patterns that institutional traders use to maximize returns.
- ✅ Identify the "Golden Buying Window"
- ✅ Avoid high-risk correction cycles
- ✅ Backtested data from the last 20+ years