February 03, 2026 a 03:31 pm
ALLE: Dividend Analysis - Allegion plc
Allegion plc presents a solid dividend offering with a moderate yield and stable growth. Its consecutive 12-year history of dividend payments demonstrates a commitment to returning value to shareholders. The current metrics indicate a sustainable payout ratio and a sound financial foundation, bolstering investor confidence. The presence of low payout ratios alongside consistent dividend growth suggests significant reinvestment back into the business, ensuring long-term growth.
📊 Overview
Allegion plc is strategically positioned within its sector, maintaining a reasonable dividend yield and a robust track record of dividend payments. The firm's financial prudence and commitment to shareholder returns are reflected in its dividend metrics.
| Sector | Dividend Yield | Current Dividend Per Share | Dividend History | Last Cut or Suspension |
|---|---|---|---|---|
| Industrial Goods | 1.28% | 1.92 USD | 12 years | None |
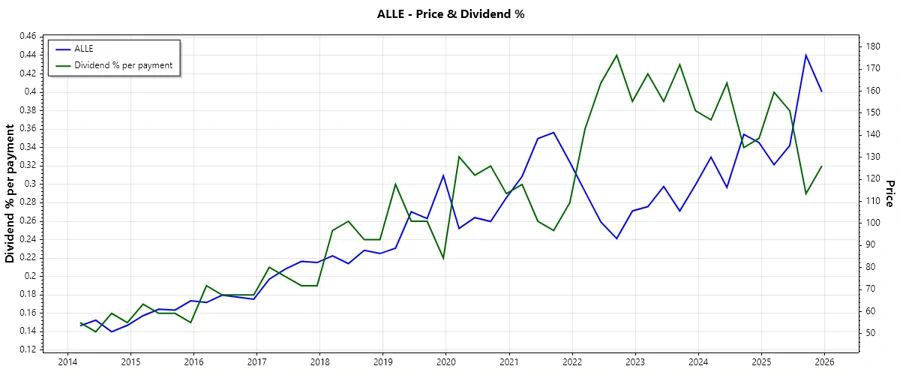
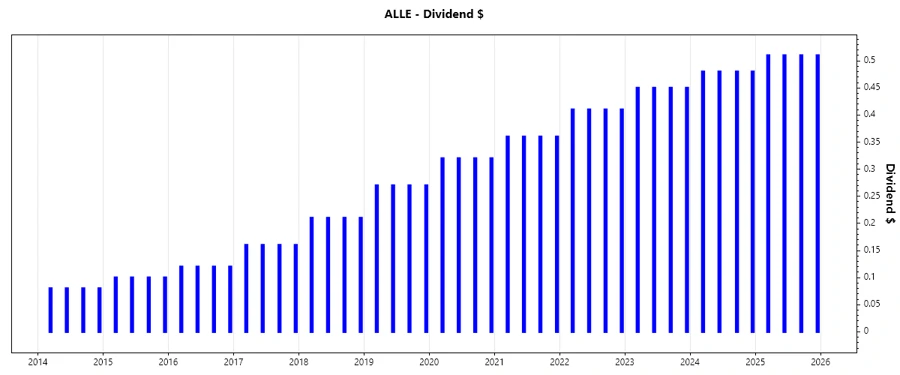
📈 Dividend History
Allegion's consistent dividend history is a testament to its financial resilience and management's focus on shareholder wealth maximization. The company's ability to deliver uninterrupted dividends over the past decade indicates a committed long-term strategy.
| Year | Dividend Per Share (USD) |
|---|---|
| 2025 | 2.04 |
| 2024 | 1.92 |
| 2023 | 1.80 |
| 2022 | 1.64 |
| 2021 | 1.44 |
📉 Dividend Growth
Allegion shows a steady dividend growth pattern, attributable to its efficient capital management and consistent earnings growth. The company’s strategy underscores sustainability and a prudent payout strategy.
| Time | Growth |
|---|---|
| 3 years | 7.55% |
| 5 years | 9.77% |
The average dividend growth is 9.77% over 5 years. This shows moderate but steady dividend growth, indicative of Allegion's reliable performance and proactive financial management.
✅ Payout Ratio
Maintaining a sustainable payout ratio is crucial for ensuring that dividends are both secure and can grow. Allegion’s payout ratio levels suggest a balanced approach to reinvestment and shareholder returns.
| Key Figure | Ratio |
|---|---|
| EPS-based | 25.69% |
| Free cash flow-based | 23.46% |
The EPS-based payout ratio of 25.69% and FCF-based ratio of 23.46% reflect a solid capacity to cover dividends from both earnings and cash flow, indicating strong dividend sustainability.
📊 Cashflow & Capital Efficiency
Sound cash flow and efficient capital allocation are critical for sustaining dividend health and stimulating growth. Allegion's cash flow metrics reveal a stable position, poised for reinvestment and reliable shareholder returns.
| 2024 | 2023 | 2022 | |
|---|---|---|---|
| Free Cash Flow Yield | 5.12% | 4.64% | 4.27% |
| Earnings Yield | 5.24% | 4.85% | 4.94% |
| CAPEX to Operating Cash Flow | 13.64% | 14.02% | 13.93% |
| Stock-based Compensation to Revenue | 0.75% | 0.72% | 0.75% |
| Free Cash Flow / Operating Cash Flow Ratio | 86.36% | 85.98% | 86.07% |
Allegion's figures illustrate robust cash efficiency and capital allocation, contributing to the company’s strategic reinvestment and dividend support capabilities.
📊 Balance Sheet & Leverage Analysis
A strong balance sheet enhances a company's ability to sustain dividends during economic downturns, while maintaining manageable levels of leverage ensures financial flexibility.
| 2024 | 2023 | 2022 | |
|---|---|---|---|
| Debt-to-Equity | 1.43 | 1.53 | 2.22 |
| Debt-to-Assets | 0.48 | 0.47 | 0.52 |
| Debt-to-Capital | 0.59 | 0.60 | 0.69 |
| Net Debt to EBITDA | 1.80 | 1.88 | 2.62 |
| Current Ratio | 2.04 | 1.26 | 1.73 |
| Quick Ratio | 1.43 | 0.85 | 1.04 |
| Financial Leverage | 2.99 | 3.27 | 4.23 |
These leverage ratios indicate a declining trend in debt reliance, which enhances Allegion’s financial stability and supports its strategic flexibility.
🔍 Fundamental Strength & Profitability
Profitability ratios and efficient use of invested capital are crucial indicators of long-term financial health and dividend-paying capacity.
| 2024 | 2023 | 2022 | |
|---|---|---|---|
| Return on Equity | 39.81% | 40.99% | 48.63% |
| Return on Assets | 13.31% | 12.53% | 11.48% |
| Margins: Net, EBIT, EBITDA, Gross | 15.84%, 21.23%, 24.31%, 44.23% | 14.80%, 19.46%, 22.51%, 43.32% | 13.99%, 18.04%, 21.04%, 40.42% |
| Research & Development to Revenue | 2.99% | 0% | 0% |
The profitability metrics demonstrate a stable and strong underlying performance and return on equity, exemplifying the company’s solid long-term investment potential.
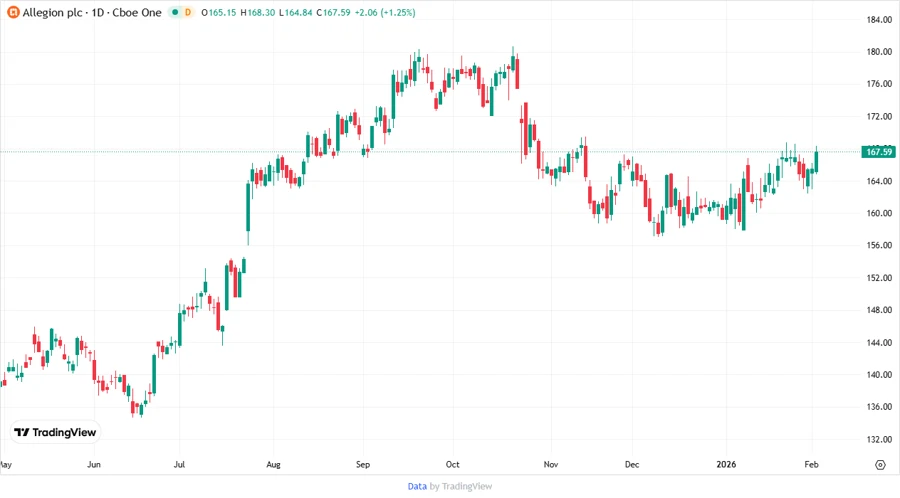
📈 Price Development
⚖️ Dividend Scoring System
| Criterion | Score | Indicator |
|---|---|---|
| Dividend Yield | 3 | |
| Dividend Stability | 5 | |
| Dividend Growth | 4 | |
| Payout Ratio | 4 | |
| Financial Stability | 4 | |
| Dividend Continuity | 5 | |
| Cashflow Coverage | 4 | |
| Balance Sheet Quality | 3 |
Total Score: 32/40
🌟 Rating
Allegion plc boasts a robust dividend profile, marked by stability, moderate growth, and financial discipline. With a consistent track record of dividend payments, sound financial metrics, and sustainable payout ratios, the company is well-positioned to service its dividends while investing in future growth. Recommended for investors seeking a balanced combination of yield and potential capital appreciation.
Smart Data Insight
Master the Perfect Entry & Exit for this Stock
Don't leave your profits to chance. Historically, this stock follows specific seasonal patterns that institutional traders use to maximize returns.
- ✅ Identify the "Golden Buying Window"
- ✅ Avoid high-risk correction cycles
- ✅ Backtested data from the last 20+ years