
July 12, 2026 a 11:44 am

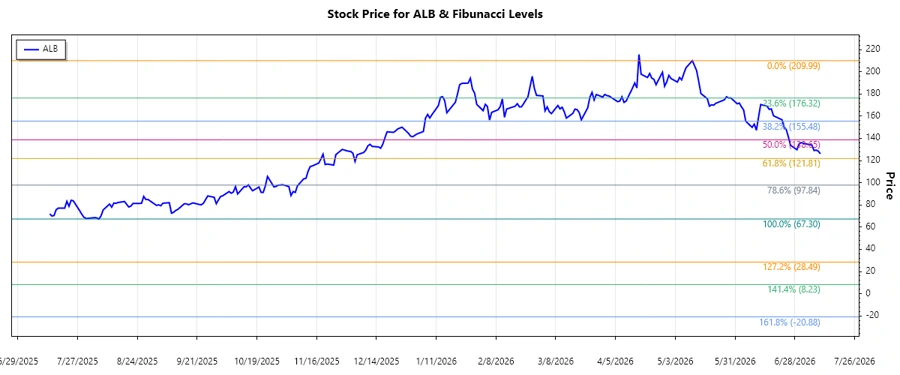
ALB: Fibonacci Analysis - Albemarle Corporation
Albemarle Corporation, a leader in the speciality chemicals sector, has experienced significant price movements in recent months. The company operates in a dynamic industry that supports green technologies, most notably through its lithium segment, essential for electric vehicle batteries. The stock recently saw a downturn, reflecting market trends and sector-specific dynamics. A detailed technical analysis, including Fibonacci retracement levels, can provide insights into potential future price directions.
Fibonacci Analysis
| Property | Value |
|---|---|
| Start Date | 2025-08-06 |
| End Date | 2026-07-12 |
| High Price | $209.99 (2026-05-11) |
| Low Price | $67.3 (2025-08-06) |
| 0.236 Level | $108.41 |
| 0.382 Level | $125.87 |
| 0.5 Level | $138.65 |
| 0.618 Level | $151.43 |
| 0.786 Level | $168.26 |
| Current Price | 126.05 |
| Current Price Zone | 0.382 |
| Analysis Interpretation | Currently the stock rests within the 0.382 retracement level, suggesting a potential resistance or consolidation zone, which could attract more buying interest if respected, or act as a resistance if breached upwards. |
Conclusion
The recent downtrend for Albemarle Corporation since May 2026 has pushed the price to crucial Fibonacci levels, indicating potential zones of support and resistance. Trading within the 0.382 Fibonacci level suggests possible consolidation or resistance, providing both potential upside and risk, especially as the company positions itself strategically within the highly variable lithium sector. Any breach of current levels may indicate further downside risk unless a reversal indicator presents itself. Understanding both technical positions and market sentiment will be crucial for refined strategic actions moving forward.
Smart Data Insight
Master the Perfect Entry & Exit for this Stock
Don't leave your profits to chance. Historically, this stock follows specific seasonal patterns that institutional traders use to maximize returns.
- ✅ Identify the "Golden Buying Window"
- ✅ Avoid high-risk correction cycles
- ✅ Backtested data from the last 20+ years