
May 26, 2026 a 11:44 am
ALB: Fibonacci Analysis - Albemarle Corporation
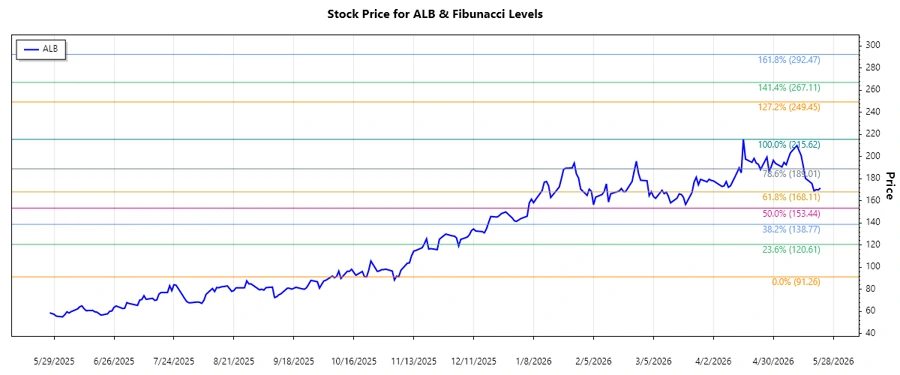
Albemarle Corporation's stock has shown significant movements recently, reflecting a dynamic business environment, especially in its lithium and catalyst segments that serve high-growth markets like electric vehicles. The company's diverse portfolio positions it well for future growth, although market volatility can influence its stock performance significantly. This analysis will provide insights into the recent trends and possible support or resistance levels using Fibonacci retracement.
Fibonacci Analysis
| Detail | Value |
|---|---|
| Trend Start Date | 2025-11-06 |
| Trend End Date | 2026-04-16 |
| High Point | $215.62 on 2026-04-16 |
| Low Point | $91.26 on 2025-11-06 |
| Fibonacci Level | Price |
|---|---|
| 0.236 | $126.39 |
| 0.382 | $141.11 |
| 0.5 | $153.44 |
| 0.618 | $165.77 |
| 0.786 | $183.24 |
The current price of $171.58 is within the 0.618 retracement zone. This suggests a potential consolidation or support area. If the price holds above the 0.618 level, it could indicate a strong support, possibly leading to a trend continuation.
Conclusion
The technical analysis of Albemarle Corporation's stock using Fibonacci retracement levels indicates that the current price is at a critical juncture, nearing the 0.618 level. This level often acts as a substantial support or resistance. The company's strategic involvement in booming sectors like electric vehicles could provide upward momentum if market conditions are favorable. However, risks include market volatility and dependency on lithium prices. Analysts should watch for price movement around this level to gauge future market sentiment and potential breakthroughs or reversals.
Smart Data Insight
Master the Perfect Entry & Exit for this Stock
Don't leave your profits to chance. Historically, this stock follows specific seasonal patterns that institutional traders use to maximize returns.
- ✅ Identify the "Golden Buying Window"
- ✅ Avoid high-risk correction cycles
- ✅ Backtested data from the last 20+ years