October 15, 2025 a 03:15 pm

ALB: Fibonacci Analysis - Albemarle Corporation
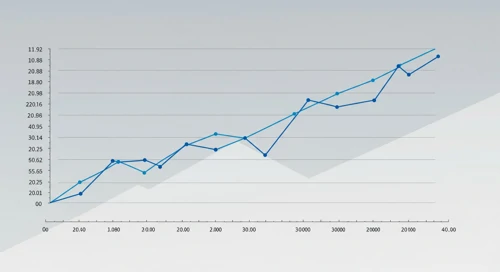
The recent analysis of Albemarle Corporation's stock, with its focus on specialty chemicals, indicates a prevailing upward trend. Investors have shown interest in Albemarle particularly due to its strong presence in the lithium market, which is crucial for the growing battery and electric vehicle industries. As the stock recovers from previous lows, the question now is whether the favorable conditions will sustain the momentum.
Fibonacci Analysis
| Parameter | Details |
|---|---|
| Trend Start Date | 2025-06-23 |
| Trend End Date | 2025-10-15 |
| High Price & Date | $97.56 on 2025-10-15 |
| Low Price & Date | $57.82 on 2025-06-23 |
Fibonacci Retracement Levels
| Level | Price |
|---|---|
| 0.236 | $77.92 |
| 0.382 | $82.08 |
| 0.5 | $85.69 |
| 0.618 | $89.29 |
| 0.786 | $93.42 |
The current stock price is approaching the 0.786 retracement level, indicating a potential resistance zone. If prices stabilize around this area, a technical interpretation would suggest a strong resistance level forming at this retracement.
Conclusion
The recent upward trend in Albemarle Corporation's stock underlines potential investment opportunities, especially with its pivotal role in the lithium industry. However, as the current price nears key Fibonacci retracement levels, it faces potential resistance. Analysts will closely monitor whether it can break past these levels, reinforcing bullish momentum, or if it will face resistance and retrace back, highlighting risk factors for the near term.
Smart Data Insight
Master the Perfect Entry & Exit for this Stock
Don't leave your profits to chance. Historically, this stock follows specific seasonal patterns that institutional traders use to maximize returns.
- ✅ Identify the "Golden Buying Window"
- ✅ Avoid high-risk correction cycles
- ✅ Backtested data from the last 20+ years