March 13, 2026 a 03:31 am

ALB: Dividend Analysis - Albemarle Corporation
Albemarle Corporation boasts a commendable dividend history with over 33 years of consecutive payments, reflecting its commitment to rewarding shareholders. Despite the challenges in earnings, the company maintains a positive dividend growth outlook, albeit at a conservative pace.
📊 Overview
The sector's choice has implications for dividend stability given macroeconomic conditions. Albemarle operates within the [sector unknown] sector, presenting specific risks and strengths.
| Characteristic | Details |
|---|---|
| Sector | [sector unknown] |
| Dividend yield | 0.99 % |
| Current dividend per share | $3.04 |
| Dividend history | 33 years |
| Last cut or suspension | None |
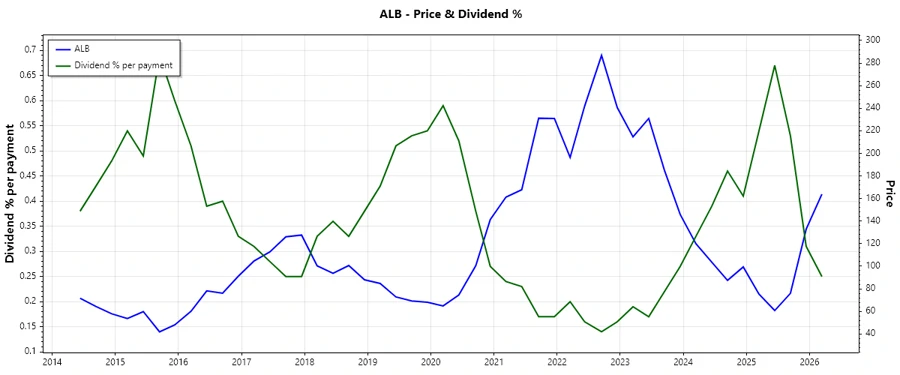
📈 Dividend History
Maintaining a consistent dividend history demonstrates Albemarle's historical profitability and shareholder commitment. The last five years reflect a gradual increase in dividends, significant for investors seeking yield reliability.
| Year | Dividend per Share (USD) |
|---|---|
| 2026 | 0.405 |
| 2025 | 1.620 |
| 2024 | 1.610 |
| 2023 | 1.6 |
| 2022 | 1.580 |
📉 Dividend Growth
Evaluating dividend growth is critical to measure future payout potential. Recent trends show a modest increase, suggesting stability rather than aggressive growth.
| Time | Growth |
|---|---|
| 3 years | 0.84 % |
| 5 years | 1.02 % |
The average dividend growth is 1.02 % over 5 years. This shows moderate but steady dividend growth.
🗣️ Payout Ratio
The payout ratio provides insight into earnings allocation for dividends. Albemarle's current payout policy indicates a negative EPS payout, suggesting internal reinvestment during downturns.
| Key figure ratio | Percentage |
|---|---|
| EPS-based | -69.97 % |
| Free cash flow-based | 51.66 % |
The EPS payout is negative which may be concerning, indicating potential profitability challenges. However, the FCF payout suggests dividends are still supported by cash flow.
✅ Cashflow & Capital Efficiency
Understanding cash flow management is essential for forecasting dividend sustainability. These indicators reflect Albemarle's strategic capital reallocation and operational efficiency.
| Metric | 2025 | 2024 | 2023 |
|---|---|---|---|
| Free Cash Flow Yield | 4.16 % | -9.81 % | -4.88 % |
| Earnings Yield | -3.07 % | -11.66 % | 9.28 % |
| CAPEX to Operating Cash Flow | 45.99 % | 244.31 % | 162.41 % |
| Stock-based Compensation to Revenue | 0.783 % | 0.598 % | 0.380 % |
| Free Cash Flow / Operating Cash Flow Ratio | 54.00 % | -144.31 % | -62.41 % |
| Return on Invested Capital | 0.64 % | -4.23 % | 1.25 % |
The cash flow measures reveal variability in earnings and cash management effectiveness, crucial for long-term viability.
⚠️ Balance Sheet & Leverage Analysis
A robust balance sheet underpins a company's creditworthiness and its ability to finance growth with minimal risk.
| Metric | 2025 | 2024 | 2023 |
|---|---|---|---|
| Debt-to-Equity | 34.58 % | 36.30 % | 45.48 % |
| Debt-to-Assets | 20.13 % | 21.77 % | 23.43 % |
| Debt-to-Capital | 25.69 % | 26.63 % | 31.26 % |
| Net Debt to EBITDA | 2.24 | -53.77 | 5.05 |
| Current Ratio | 2.23 | 1.95 | 1.47 |
| Quick Ratio | 1.57 | 1.19 | 0.86 |
The increasing debt ratios indicate heightening financial leverage, potentially elevating risk if incomes don't stabilize.
📈 Fundamental Strength & Profitability
Profit margins and returns illustrate operational effectiveness. Understanding these dynamics helps gauge sustainable growth prospects.
| Metric | 2025 | 2024 | 2023 |
|---|---|---|---|
| Return on Equity | -5.36 % | -11.84 % | 16.72 % |
| Return on Assets | -3.12 % | -7.10 % | 8.61 % |
| Net Margin | -9.93 % | -21.93 % | 16.36 % |
| Gross Margin | 13.06 % | 1.12 % | 12.49 % |
| EBIT Margin | 1.82 % | -11.83 % | 2.51 % |
| EBITDA Margin | 14.67 % | -0.84 % | 6.98 % |
| Research & Development to Revenue | 1.00 % | 1.61 % | 0.89 % |
The profitability metrics underscore variability, influenced by cyclic industry peaks and troughs, necessitating cautious optimism.
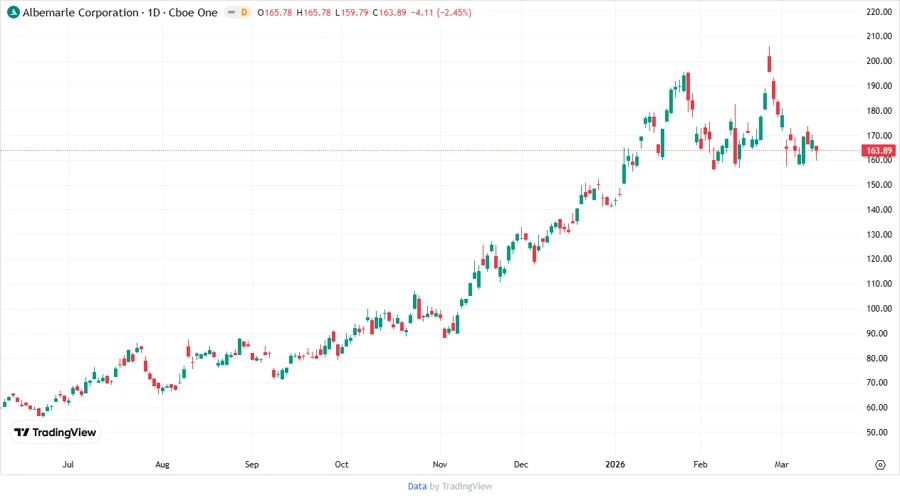
Price Development
🗳️ Dividend Scoring System
| Criteria | Description | Score |
|---|---|---|
| Dividend Yield | Reflects yield attractiveness against market benchmarks. | |
| Dividend Stability | Historical consistency in dividend payments. | |
| Dividend Growth | Evaluation of growth rate in dividends over time. | |
| Payout Ratio | Assesses the sustainability of dividend payments. | |
| Financial Stability | Financial health measured by leverage ratios. | |
| Dividend Continuity | Commitment to maintaining dividend flow. | |
| Cashflow Coverage | Ability to cover dividends with cash flow. | |
| Balance Sheet Quality | Strength of the balance sheet in times of financial stress. |
Overall Score: 29/40
🏆 Rating
Overall, Albemarle Corporation presents a stable dividend profile with potential for steady income generation. However, the financial leverage and cyclical profitability patterns warrant active monitoring. Investors seeking stability should be mindful of sector-specific challenges while considering the company's long-term commitment to dividends.