November 15, 2025 a 03:31 am

ALB: Dividend Analysis - Albemarle Corporation
Albemarle Corporation exhibits robustness in its dividend history with a solid track record of payments over the last 32 years. Despite the challenging financial metrics, the company maintains shareholder trust by consistently delivering dividends. The calculated payout ratios highlight the existing challenges, yet the long-term growth potential and strategic industry position provide a buffer. Investors should consider the external market conditions impacting free cash flow as well as Albemarle's historical resilience.
📊 Overview
| Indicator | Value |
|---|---|
| Sector | Specialty Chemicals |
| Dividend Yield | 1.41% |
| Current Dividend per Share | 2.65 USD |
| Dividend History | 32 years |
| Last Cut or Suspension | 1999 |
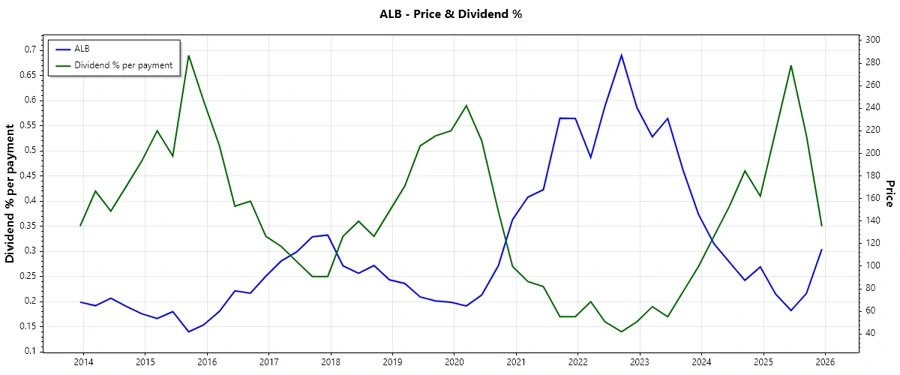
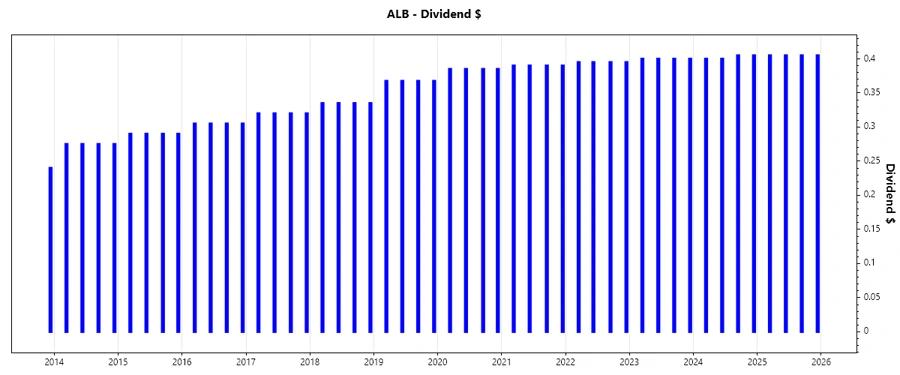
📈 Dividend History
The dividend history of Albemarle Corporation underscores its commitment to long-term shareholder returns. A history without significant cuts since 1999 signifies stability, crucial for income-focused investors.
| Year | Dividend per Share (USD) |
|---|---|
| 2025 | 1.62 |
| 2024 | 1.61 |
| 2023 | 1.60 |
| 2022 | 1.58 |
| 2021 | 1.56 |
🗣️ Dividend Growth
The moderate dividend growth reflects the company's strategy to gradually enhance shareholder value. Steady growth over five years displays resilience, although the rate is modest.
| Time | Growth |
|---|---|
| 3 years | 1.06% |
| 5 years | 1.84% |
The average dividend growth is 1.84% over 5 years. This shows moderate but steady dividend growth.
✅ Payout Ratio
The payout ratio, a critical factor in assessing dividend sustainability, indicates short-term earnings challenges. However, free cash flow remains a key driver, urging scrutiny of ongoing cash flow stability.
| Key figure ratio | Percentage |
|---|---|
| EPS-based | -496.03% |
| Free cash flow-based | 298.87% |
The very high EPS-based payout ratio at -496.03% suggests that earnings alone do not cover dividends, while the FCF-based ratio of 298.87% highlights significant challenges in cash allocation.
🧐 Cashflow & Capital Efficiency
Cash flow efficiency strongly affects Albemarle's ability to sustain dividends. Key metrics such as Earnings Yield and CAPEX highlight the operational cash dynamics pivotal to dividend coverage.
| Year | 2024 | 2023 | 2022 |
|---|---|---|---|
| Free Cash Flow Yield | -9.72% | -4.86% | 2.54% |
| Earnings Yield | -11.66% | 9.28% | 10.59% |
| CAPEX to Operating Cash Flow | 240.12% | 162.17% | 66.13% |
| Stock-based Compensation to Revenue | 0.60% | 0.38% | 0.42% |
| Free Cash Flow / Operating Cash Flow Ratio | -140.12% | -62.17% | 33.87% |
The cash flow metrics signal potential risk, but strategic allocation and control of expenses can mitigate adverse impacts.
💰 Balance Sheet & Leverage Analysis
Leveraging capital efficiently while maintaining financial stability is crucial for dividend payments. The debt to equity ratio provides insight into asset dependency on debt management.
| Year | 2024 | 2023 | 2022 |
|---|---|---|---|
| Debt-to-Equity | 36.30% | 45.48% | 41.54% |
| Debt-to-Assets | 21.77% | 23.43% | 21.46% |
| Debt-to-Capital | 26.63% | 31.26% | 29.35% |
| Net Debt to EBITDA | -2.80 | 4.27 | 0.64 |
| Current Ratio | 1.95 | 1.46 | 1.89 |
| Quick Ratio | 1.19 | 0.86 | 1.13 |
| Financial Leverage | 1.67 | 1.94 | 1.94 |
The analysis shows solid balance sheet management; however, liquidity constraints need proactive management to avoid leverage issues and ensure dividend continuity.
🏆 Fundamental Strength & Profitability
Strong fundamentals, including Return on Equity (ROE) and Asset Return, create the foundation for consistent dividend payment capability.
| Year | 2024 | 2023 | 2022 |
|---|---|---|---|
| Return on Equity | -11.84% | 16.72% | 33.70% |
| Return on Assets | -7.10% | 8.61% | 17.40% |
| Net Profit Margin | -21.93% | 16.36% | 36.75% |
| EBIT Margin | -29.72% | 3.77% | 34.92% |
| EBITDA Margin | -18.77% | 8.24% | 39.03% |
| Gross Margin | 1.16% | 12.33% | 42.00% |
| Research & Development to Revenue | 1.61% | 0.89% | 0.98% |
While profitability has been challenged in recent years, innovation investment indicates potential for recovery and enhanced profitability.
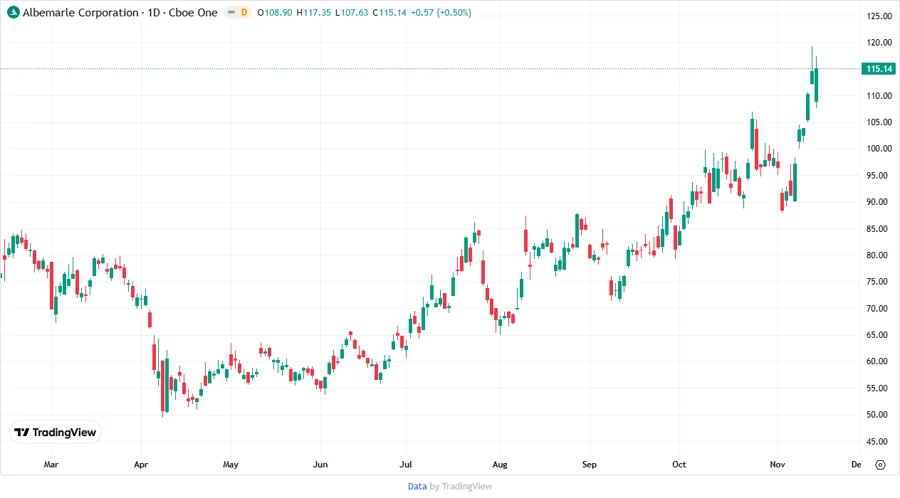
📉 Price Development
🔢 Dividend Scoring System
| Criterion | Description | Score |
|---|---|---|
| Dividend yield | Acceptable yield relative to sector peers. | 2 |
| Dividend Stability | Long history without cuts. | 4 |
| Dividend growth | Slow, steady growth rate. | 3 |
| Payout ratio | High payout ratio, limits flexibility. | 1 |
| Financial stability | Mixed metrics on leverage and liquidity. | 2 |
| Dividend continuity | Sustained without major suspensions. | 4 |
| Cashflow Coverage | Cash flow covers dividends, but under pressure. | 2 |
| Balance Sheet Quality | Stable balance despite debt challenges. | 3 |
Total Score: 21/40
🔍 Rating
Albemarle Corporation's dividend profile presents a commendable long-term track record. Despite current financial and economic pressures, the historical resilience and market opportunities support a cautious investment consideration. Risk-averse investors may find value in the company's strategic positioning within the specialty chemicals sector, though vigilance regarding dividend sustainability remains prudent.
Smart Data Insight
Master the Perfect Entry & Exit for this Stock
Don't leave your profits to chance. Historically, this stock follows specific seasonal patterns that institutional traders use to maximize returns.
- ✅ Identify the "Golden Buying Window"
- ✅ Avoid high-risk correction cycles
- ✅ Backtested data from the last 20+ years