October 24, 2025 a 02:47 am
ALB: Dividend Analysis - Albemarle Corporation
Albemarle Corporation, an industry leader in specialty chemicals, has a robust dividend history, reflecting its commitment to returning value to shareholders. However, recent financial indices show challenges, primarily in its earnings and cash flow capabilities. The company maintains a competitive dividend yield coupled with long-standing stability, making it a notable choice for dividend investors interested in long-term holdings.
Overview
Albemarle's position in the specialty chemicals sector provides industry resilience and growth potential, though it's currently operating with a challenging financial backdrop. The dividend yield stands at 2.13%, with a current dividend per share of 2.65 USD, supported by an impressive 32-year history of dividends. Despite this, the absence of recent cuts does not mitigate underlying financial strain.
| Category | Details |
|---|---|
| Sector | Specialty Chemicals |
| Dividend Yield | 2.13% |
| Current Dividend Per Share | 2.65 USD |
| Dividend History | 32 years |
| Last Cut or Suspension | None |
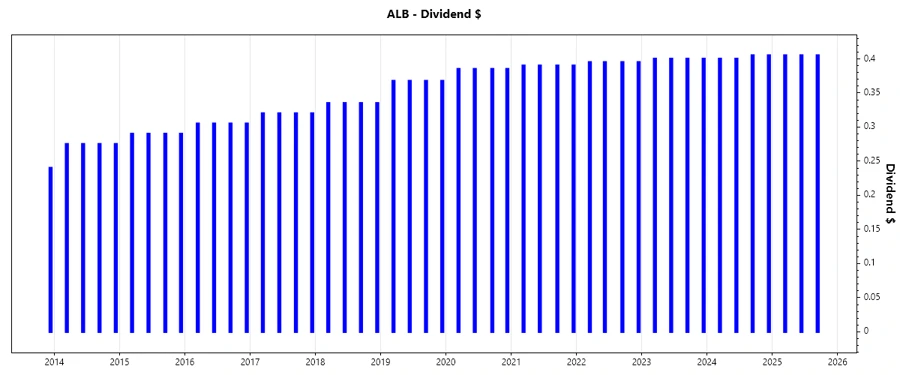
Dividend History
With a strong history of dividend payments, Albemarle showcases stability, a crucial factor for income-focused investors. The dividends have shown modest increments over years, providing a reliable income stream.
| Year | Dividend Per Share (USD) |
|---|---|
| 2025 | 1.215 |
| 2024 | 1.610 |
| 2023 | 1.600 |
| 2022 | 1.580 |
| 2021 | 1.560 |
Dividend Growth
The growth of dividends over the last 3 to 5 years highlights Albemarle's cautious but continuous increment strategy in shareholder returns.
| Time | Growth |
|---|---|
| 3 years | 1.06% |
| 5 years | 1.84% |
The average dividend growth is 1.84% over 5 years. This shows moderate but steady dividend growth.
Payout Ratio
Payout ratios are crucial indicators of sustainability. A negative EPS-based ratio (-33.53%) alongside a FCF-based ratio (-174.78%) reflects alarming conditions.
| Key figure ratio | Value |
|---|---|
| EPS-based | -33.53% |
| Free Cash Flow-based | -174.78% |
These payout ratios are unsustainable, indicating potential risks in maintaining current dividend policies without financial recovery.
Cashflow & Capital Efficiency
The analysis of cash flow and capital efficiency shows the company's challenges in generating positive cash flow and efficiency metrics.
| Year | 2024 | 2023 | 2022 |
|---|---|---|---|
| Free Cash Flow Yield | -9.72% | -4.86% | 2.54% |
| Earnings Yield | -11.66% | 9.28% | 10.59% |
| CAPEX to Operating Cash Flow | 240.12% | 162.17% | 66.13% |
| Stock-based Compensation to Revenue | 0.60% | 0.38% | 0.41% |
| Free Cash Flow / Operating Cash Flow Ratio | -140.12% | -62.17% | 33.87% |
The negative cash flow stability points toward inefficiency in using capital, calling for strategic improvements.
Balance Sheet & Leverage Analysis
Leverage and liquidity ratios show the company's financial structure and ability to deal with obligations.
| Year | 2024 | 2023 | 2022 |
|---|---|---|---|
| Debt-to-Equity | 0.36 | 0.45 | 0.42 |
| Debt-to-Assets | 0.22 | 0.23 | 0.21 |
| Debt-to-Capital | 0.27 | 0.31 | 0.29 |
| Net Debt to EBITDA | -6.79 | 4.28 | 0.64 |
| Current Ratio | 2.31 | 1.47 | 1.89 |
| Quick Ratio | 1.19 | 0.86 | 1.13 |
| Financial Leverage | 1.67 | 1.94 | 1.94 |
The balance sheet shows a manageable debt load but highlights significant challenges in leveraging assets efficiently.
Fundamental Strength & Profitability
Profitability and margin analysis offers critical insights into Albemarle's operational efficiency and strategic alignment.
| Year | 2024 | 2023 | 2022 |
|---|---|---|---|
| Return on Equity | -11.84% | 16.72% | 33.70% |
| Return on Assets | -7.10% | 8.61% | 17.40% |
| Net Profit Margin | -21.93% | 16.36% | 36.75% |
| EBIT Margin | -29.72% | 3.77% | 34.92% |
| EBITDA Margin | -18.77% | 8.24% | 39.03% |
| Gross Profit Margin | 1.16% | 12.33% | 42.00% |
| Research & Development to Revenue | 1.61% | 0.89% | 0.98% |
Fundamentals indicate profitability volatility, with a need for strategic focus on cost management and operational efficiency.
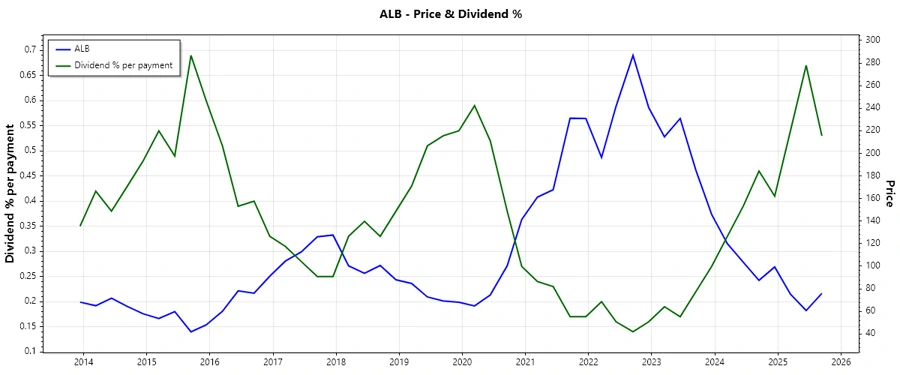
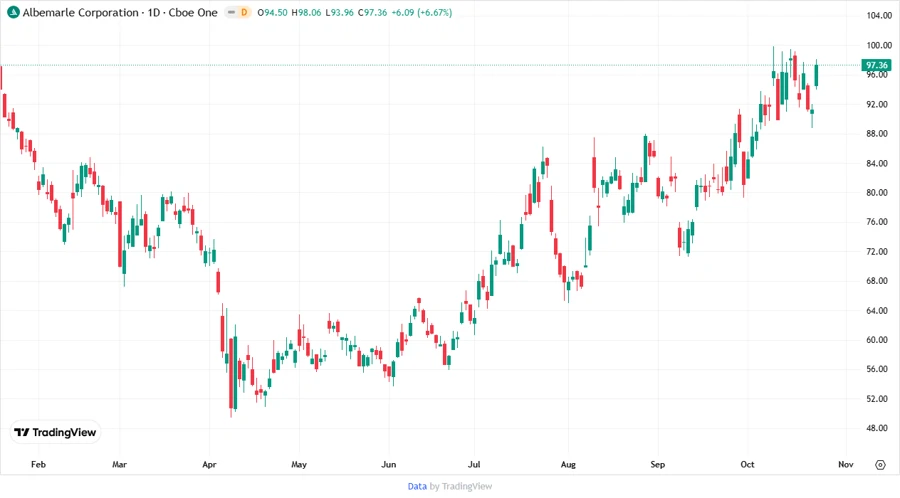
Price Development
Dividend Scoring System
| Criteria | Score / 5 | Score Bar |
|---|---|---|
| Dividend Yield | 4 | |
| Dividend Stability | 5 | |
| Dividend Growth | 3 | |
| Payout Ratio | 2 | |
| Financial Stability | 2 | |
| Dividend Continuity | 5 | |
| Cashflow Coverage | 2 | |
| Balance Sheet Quality | 3 |
Total Score: 26/40
Rating
Albemarle Corporation presents a strong dividend continuity and stability with an admirable yield. Nonetheless, its financial metrics underscore pressing concerns marked by negative earnings and cash flow shortcomings. It stands as a viable choice for dividend-centric portfolios with high tolerance for risk.
Smart Data Insight
Master the Perfect Entry & Exit for this Stock
Don't leave your profits to chance. Historically, this stock follows specific seasonal patterns that institutional traders use to maximize returns.
- ✅ Identify the "Golden Buying Window"
- ✅ Avoid high-risk correction cycles
- ✅ Backtested data from the last 20+ years