September 24, 2025 a 03:32 am
ALB: Dividend Analysis - Albemarle Corporation
🗣️ Albemarle Corporation, a well-established firm, exhibits strong dividend stability, maintaining consistency over the past 32 years. The company offers a moderate yield of 2.13%, with a diligent growth approach. Despite current challenges in profitability, its long-term dividend reliability boosts investor confidence.
📊 Overview
Albemarle Corporation operates within the Chemicals sector and has admirably maintained steady dividends over an impressive span of 32 years, indicating robust dividend reliability and investor trust.
| Metric | Details |
|---|---|
| Sector | Chemicals |
| Dividend Yield | 2.13% |
| Current Dividend Per Share | 2.65 USD |
| Dividend History | 32 years |
| Last Cut or Suspension | None |
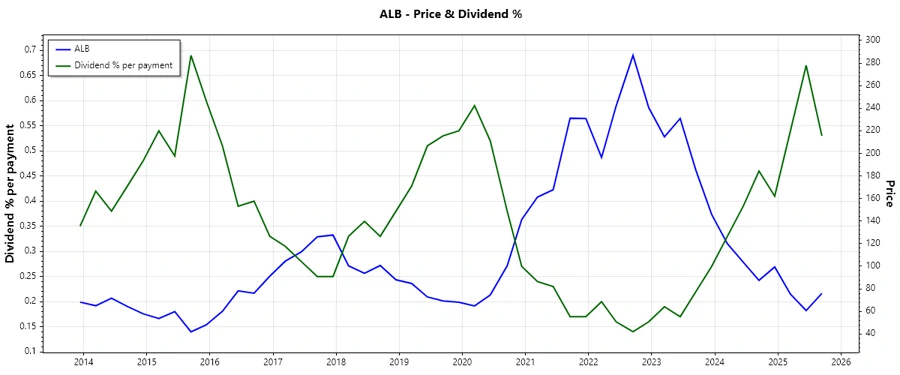
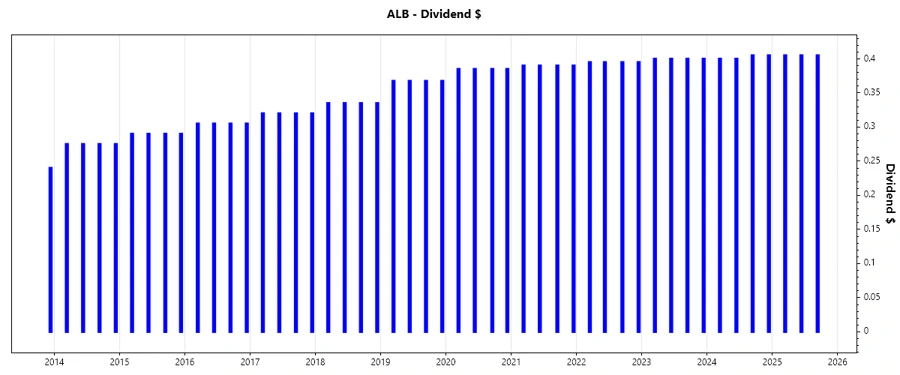
📈 Dividend History
Albemarle's dividend history stands out with 32 years of uninterrupted payments, which serves as a beacon of its stable financial management. Historical performance is a critical factor for income-focused investors.
| Year | Dividend Per Share (USD) |
|---|---|
| 2025 | 1.215 |
| 2024 | 1.610 |
| 2023 | 1.600 |
| 2022 | 1.580 |
| 2021 | 1.560 |
📈 Dividend Growth
The firm’s dividend growth over 3 and 5 years suggests a conservative but consistent appreciation, essential for long-term dividend growth strategies.
| Time | Growth |
|---|---|
| 3 years | 1.06% |
| 5 years | 1.84% |
The average dividend growth is 1.84% over 5 years. This shows moderate but steady dividend growth.
📉 Payout Ratio
Currently, Albemarle’s payout ratios are negative across EPS and FCF metrics, an indicator of potential operational reinvestments or temporary income challenges.
| Key Figure | Ratio |
|---|---|
| EPS-based | -33.53% |
| Free cash flow-based | -174.78% |
While these negative figures indicate reinvestment efforts or income fluctuations, they necessitate close monitoring to assess future dividend sustainability.
✅ Cashflow & Capital Efficiency
Evaluating the determinants of free cash flow yield and operating cash ratio reveals insights into Albemarle's operational liquidity and reinvestment efficiency.
| Year | 2024 | 2023 | 2022 |
|---|---|---|---|
| Free Cash Flow Yield | -9.72% | -4.86% | 2.54% |
| Earnings Yield | -11.66% | 9.28% | 10.59% |
| CAPEX to Operating Cash Flow | 240.12% | 162.17% | 66.13% |
| Stock-based Compensation to Revenue | 0.60% | 0.38% | 0.42% |
| Free Cash Flow / Operating Cash Flow Ratio | -140.12% | -62.02% | 33.87% |
Notable fluctuations in cash flow yield reflect operational investments; however, positive shifts in operating cash flow ratio illustrate improvements towards capital efficiency.
⚠️ Balance Sheet & Leverage Analysis
Debt assessment metrics such as debt-to-equity and net debt to EBITDA ratios are paramount in deciphering financial health and leverage capacity.
| Year | 2024 | 2023 | 2022 |
|---|---|---|---|
| Debt-to-Equity | 36.30% | 45.48% | 41.54% |
| Debt-to-Assets | 21.77% | 23.43% | 21.46% |
| Debt-to-Capital | 26.63% | 31.26% | 29.35% |
| Net Debt to EBITDA | -2.40 | 4.28 | 0.64 |
| Current Ratio | 0 | 0 | 0 |
| Quick Ratio | 1.19 | 0.86 | 1.13 |
The leverage position indicates a controlled debt structure, though the net debt to EBITDA ratio in recent years suggests a potential risk in cash flow coverage.
✅ Fundamental Strength & Profitability
Core profitability indicators such as return on assets and equity underscore Albemarle’s operational efficacy and profit margins' trajectory.
| Year | 2024 | 2023 | 2022 |
|---|---|---|---|
| Return on Equity | -11.84% | 16.72% | 33.70% |
| Return on Assets | -7.10% | 8.61% | 17.40% |
| Margins: Net | -21.93% | 16.36% | 36.75% |
| Margins: EBIT | -29.72% | 3.77% | 34.92% |
| Margins: EBITDA | -18.77% | 8.24% | 39.03% |
| Margins: Gross | 1.16% | 12.33% | 42.00% |
| R&D to Revenue | 1.61% | 0.89% | 0.98% |
Profitability metrics illustrate volatility, yet show strong R&D investment commitment which can fuel future advances and market positioning.
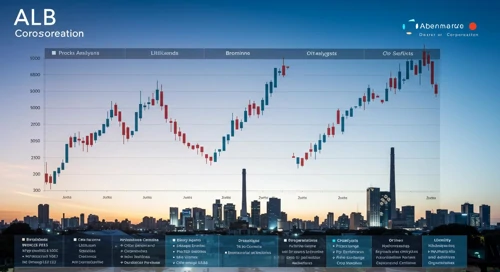
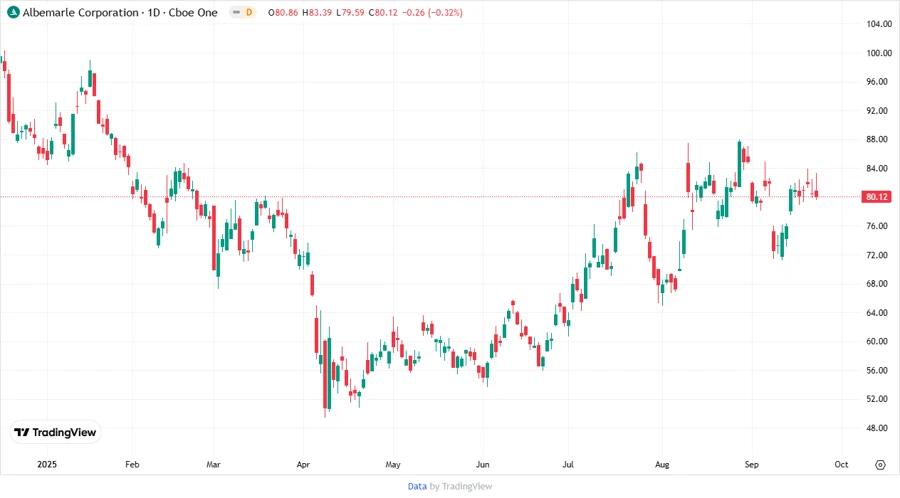
📉 Price Development
✅ Dividend Scoring System
| Criteria | Score | |
|---|---|---|
| Dividend yield | 3 | |
| Dividend Stability | 5 | |
| Dividend growth | 2 | |
| Payout ratio | 2 | |
| Financial stability | 3 | |
| Dividend continuity | 5 | |
| Cashflow Coverage | 3 | |
| Balance Sheet Quality | 3 |
Overall Score: 26/40
✅ Rating
Albemarle Corporation demonstrates strong dividend stability marked by an illustrious history of 32 consistent years. However, current fiscal metrics signal apprehension necessitating critical oversight. The enterprise's commitment to R&D and innovation posits long-term potential, yet prudence is advised amidst evident profit volatility. A hold recommendation is suitable under current forecasts, but prospective capital appreciations could prove opportunistic as operational efficiencies strengthen.
Smart Data Insight
Master the Perfect Entry & Exit for this Stock
Don't leave your profits to chance. Historically, this stock follows specific seasonal patterns that institutional traders use to maximize returns.
- ✅ Identify the "Golden Buying Window"
- ✅ Avoid high-risk correction cycles
- ✅ Backtested data from the last 20+ years