August 10, 2025 a 07:31 am


ALB: Dividend Analysis - Albemarle Corporation
Albemarle Corporation, a diversified specialty chemicals manufacturing company, has solidified its position with a consistent dividend history spanning 32 years. Despite challenges reflected by negative payout ratios and fluctuating profitability metrics, the company maintains an admirable dividend yield of 2.15%. Investors should be cautious about the company's dividend growth, which shows moderate increment over the past years.
📊 Overview
| Metric | Value |
|---|---|
| Sector | Chemicals |
| Dividend yield | 2.15% |
| Current dividend per share | $2.65 |
| Dividend history | 32 years |
| Last cut or suspension | None |
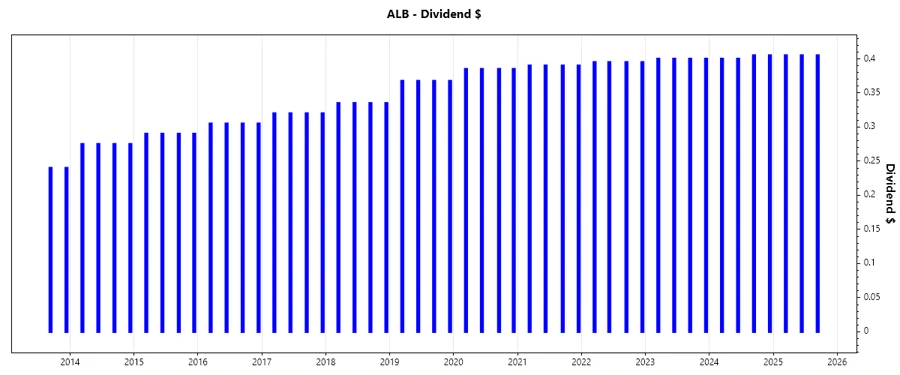
🗣️ Dividend History
The consistency in Albion's dividend history, spanning over three decades, indicates an established payout strategy. This is a testament to their commitment to returning value to shareholders, despite recent financial strains.
| Year | Dividend per Share (USD) |
|---|---|
| 2025 | $1.215 |
| 2024 | $1.610 |
| 2023 | $1.600 |
| 2022 | $1.580 |
| 2021 | $1.560 |
📈 Dividend Growth
Albemarle's modest dividend growth of 1.83% over the past 5 years reflects a cautious reiteration of shareholder value, signaling internal reinvestment strategies or market adaptation efforts.
| Time | Growth |
|---|---|
| 3 years | 1.06% |
| 5 years | 1.84% |
The average dividend growth is 1.84% over 5 years. This shows moderate but steady dividend growth.
⚠️ Payout Ratio
Payout ratios provide insights into Albemarle's financial strategies. Current negative values suggest financial pressures, as the EPS-based payout ratio is -33.52%, and the FCF-based stands at a challenging -568.07%. This highlights discrepancies between profitability and cash flow allocation.
| Key figure | Ratio |
|---|---|
| EPS-based | -33.52% |
| Free cash flow-based | -568.07% |
💰 Cashflow & Capital Efficiency
The following metrics underscore Albemarle's cash flow health and capital deployment efficiencies. Assessing these is crucial as they highlight potential operational challenges and strategic capital allocations.
| Metric | 2022 | 2023 | 2024 |
|---|---|---|---|
| Free Cash Flow Yield | 2.54% | -4.86% | -9.72% |
| Earnings Yield | 8.04% | 9.28% | -11.66% |
| CAPEX to Operating Cash Flow | 66.13% | 162.17% | 240.11% |
| Stock-based Compensation to Revenue | 0.42% | 0.38% | 0.60% |
| Free Cash Flow / Operating Cash Flow Ratio | 33.87% | -62.17% | -140.11% |
These challenges in free cash flow yield and high CAPEX ratios indicate a potential strain on near-term liquidity.
📉 Balance Sheet & Leverage Analysis
Analyzing these leverage and liquidity metrics helps investors gauge Albemarle's ability to meet its financial obligations and sustainably manage debt.
| Metric | 2022 | 2023 | 2024 |
|---|---|---|---|
| Debt-to-Equity | 40.30% | 45.80% | 36.30% |
| Debt-to-Assets | 20.81% | 23.60% | 21.77% |
| Net Debt to EBITDA | 0.60 | 4.32 | -2.40 |
| Current Ratio | 1.89 | 1.47 | 1.95 |
| Quick Ratio | 1.13 | 0.86 | 1.19 |
| Financial Leverage | 1.94 | 1.94 | 1.67 |
The stabilization in debt levels and improvements in liquidity ratios are reassuring, but the negative net debt-to-EBITDA in 2024 requires close monitoring.
✅ Fundamental Strength & Profitability
The following metrics provide insight into Albemarle's fundamental performance, analyzing profitability and efficiency in capital utilization.
| Metric | 2022 | 2023 | 2024 |
|---|---|---|---|
| Return on Equity | 25.59% | 16.71% | -11.84% |
| Return on Assets | 13.22% | 8.61% | -7.10% |
| Net Margin | 27.91% | 16.36% | -21.93% |
| EBIT Margin | 34.92% | 3.77% | -29.72% |
| Research & Development to Revenue | 0.98% | 0.89% | 1.61% |
The profitability metrics show variance, highlighting periodic challenges, yet showcase investment in R&D that could fuel future growth.
📉 Price Development
✅ Dividend Scoring System
| Category | Score | Visual |
|---|---|---|
| Dividend yield | 3 | |
| Dividend Stability | 4 | |
| Dividend Growth | 2 | |
| Payout Ratio | 1 | |
| Financial Stability | 2 | |
| Dividend Continuity | 5 | |
| Cashflow Coverage | 1 | |
| Balance Sheet Quality | 3 |
Total Score: 21/40
🗣️ Rating
Albemarle Corporation holds a resilient dividend background with a commitment to shareholder returns. While facing financial obstacles highlighted by negative payout ratios and profitability challenges, the strong continuity of dividends and strategic R&D investments suggest potential for long-term growth. Cautious optimism is recommended for investors, pending further improvements in financial metrics.
Smart Data Insight
Master the Perfect Entry & Exit for this Stock
Don't leave your profits to chance. Historically, this stock follows specific seasonal patterns that institutional traders use to maximize returns.
- ✅ Identify the "Golden Buying Window"
- ✅ Avoid high-risk correction cycles
- ✅ Backtested data from the last 20+ years