October 16, 2025 a 01:15 pm
AKAM: Trend and Support & Resistance Analysis - Akamai Technologies, Inc.
Akamai Technologies, Inc., a leader in cloud services, demonstrates resilience in safeguarding digital infrastructures while optimizing online content delivery. The recent technical analysis of AKAM stock reflects a dynamic but slightly bearish sentiment. Investors should focus on key support and resistance zones while keeping an eye on broader market trends for potential opportunities or risks.
Trend Analysis
The following table provides a snapshot of the last 7 trading days for AKAM, illustrating the closing prices and trend direction:
| Date | Close Price | Trend |
|---|---|---|
| 2025-10-15 | 73.67 | ▼ |
| 2025-10-14 | 74.09 | ▲ |
| 2025-10-13 | 73.80 | ▼ |
| 2025-10-10 | 73.24 | ▼ |
| 2025-10-09 | 75.50 | ▲ |
| 2025-10-08 | 76.72 | ▲ |
| 2025-10-07 | 76.60 | ▼ |
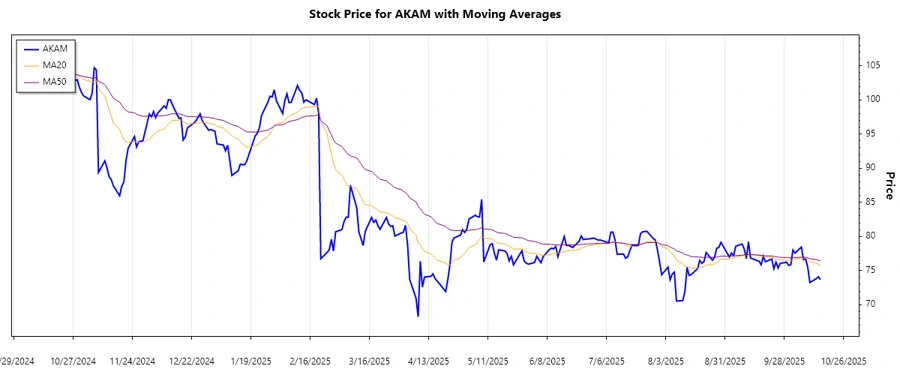
The current downtrend indicated by EMA analysis suggests caution. Although recent price action shows fluctuation, EMA20 is consistently below EMA50.
Support and Resistance
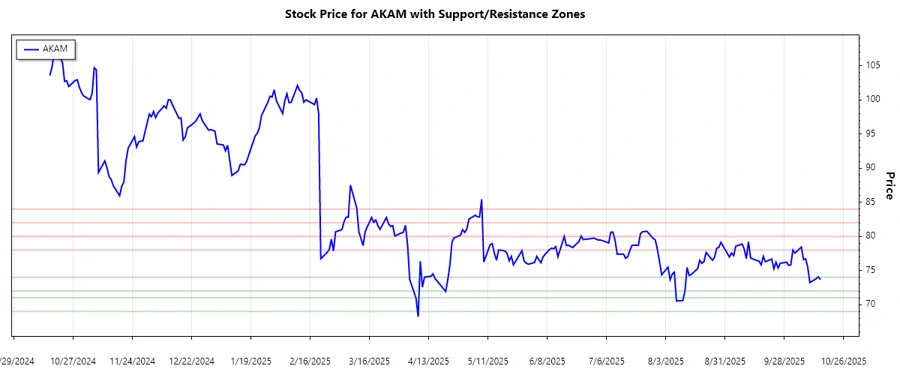
Below are key support and resistance levels derived from recent AKAM trading patterns:
| Zone Type | From | To |
|---|---|---|
| Support | 72.00 | 74.00 |
| Support | 69.00 | 71.00 |
| Resistance | 78.00 | 80.00 |
| Resistance | 82.00 | 84.00 |
The current closing price places it within the primary support zone, suggesting potential price stability unless breached.
Conclusion
The technical evaluation of Akamai Technologies, Inc. reflects a short-term bearish sentiment, given the prevailing downward trend of the EMA. Investors may find opportunities in price rebounds from support levels or if the trend reverses upwards. Current volatility offers potential short-term trading opportunities; however, risks remain if support zones fail. Monitoring these zones closely will provide insight into future price movements, aiding investors in making informed decisions.