September 25, 2025 a 08:15 am
AKAM: Trend and Support & Resistance Analysis - Akamai Technologies, Inc.
Akamai Technologies, Inc. has been a pivotal player in providing cloud-based content delivery and security solutions. The recent analysis indicates a nuanced performance in the market with notable price fluctuations across the months. The trend analysis and support & resistance evaluation will give further insights into potential trading strategies for the stock. Investors should be vigilant of market conditions influencing Akamai's operations globally.
Trend Analysis
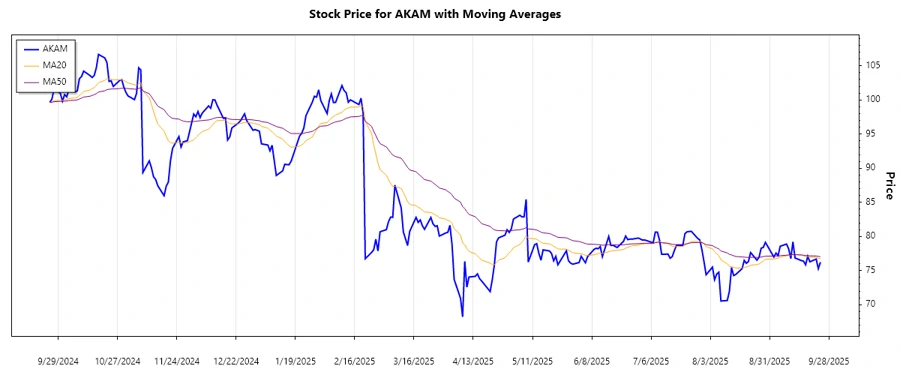
The trend analysis of Akamai Technologies (AKAM) reveals a complex market movement over the last few months. Utilizing Exponential Moving Averages (EMA), the EMA20, and EMA50 indicators guide our understanding of the trend direction.
| Date | Close Price | Trend |
|---|---|---|
| 2025-09-24 | 76.23 | ▼ |
| 2025-09-23 | 75.27 | ▼ |
| 2025-09-22 | 76.68 | ▲ |
| 2025-09-19 | 76.28 | ▼ |
| 2025-09-18 | 77.09 | ▲ |
| 2025-09-17 | 75.84 | ▼ |
| 2025-09-16 | 76.38 | ▲ |
The analysis shows a recent downtrend with sporadic bullish days. EMA comparison suggests a current ⚖️ Sideways trend.
Support- and Resistance
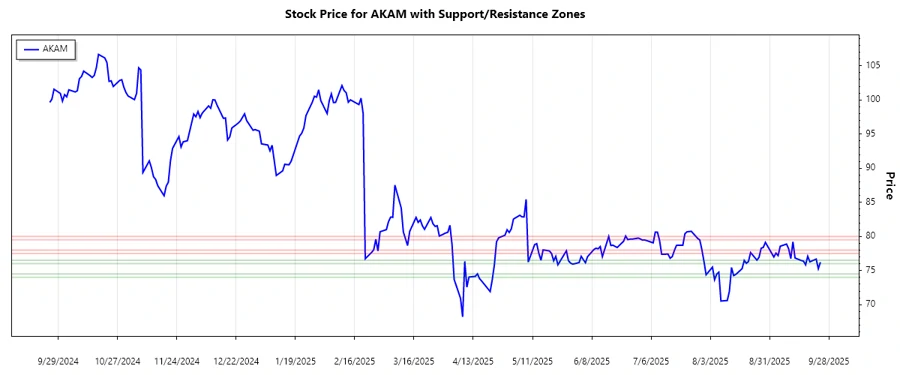
By analyzing the price data, we identify crucial support and resistance levels critical for decision-making.
| Zone Type | From | To |
|---|---|---|
| Support | 76.00 ▼ | 76.50 ▲ |
| Support | 74.00 ▼ | 74.50 ▲ |
| Resistance | 77.50 ▲ | 78.00 ▼ |
| Resistance | 79.50 ▲ | 80.00 ▼ |
The latest price is near the lower support zone, suggesting possible buying interest in this area.
Conclusion
In conclusion, Akamai Technologies, Inc. shows a mixed performance with both bullish and bearish indicators noted. The EMA analysis points to a sideways market, emphasizing caution for traders. Support and resistance levels suggest potential areas of market reversal, providing strategic entry or exit points for investors. Monitoring technical signals and market developments is key for optimizing positions in this stock. Overall, the stock presents both risks and opportunities depending on market conditions and investor sentiment.
Smart Data Insight
Master the Perfect Entry & Exit for this Stock
Don't leave your profits to chance. Historically, this stock follows specific seasonal patterns that institutional traders use to maximize returns.
- ✅ Identify the "Golden Buying Window"
- ✅ Avoid high-risk correction cycles
- ✅ Backtested data from the last 20+ years