November 17, 2025 a 05:15 am

AKAM: Fibonacci Analysis - Akamai Technologies, Inc.
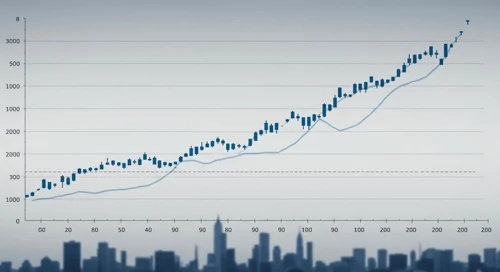
Akamai Technologies, Inc. (NASDAQ: AKAM) has shown a notable uptrend over the past few months, demonstrating resilience amidst market fluctuations. With a strong business model in the cloud services sector, it continues to protect and optimize online performance for a wide range of clients globally. Investors are eager to see whether this uptrend will continue, especially as security remains a top priority in the digital landscape.
Fibonacci Analysis
Upon analyzing the recent trend, Akamai Technologies has been in a dominant uptrend. Utilizing Fibonacci retracement levels helps in identifying potential support areas.
| Information | Details |
|---|---|
| Trend Start Date | 2025-08-11 |
| Trend End Date | 2025-11-14 |
| Highest Price - Date | $90.61 - 2025-11-11 |
| Lowest Price - Date | $70.53 - 2025-08-08 |
| Fibonacci Level | Price |
|---|---|
| 0.236 | $85.50 |
| 0.382 | $82.36 |
| 0.5 | $80.57 |
| 0.618 | $78.78 |
| 0.786 | $75.92 |
The current price at the last data point is $87.17, which suggests it is not within the Fibonacci retracement range but closer to a resistance level near the high.
This could indicate strong buying interest as the price might soon challenge the previous highs, or a potential for a short-term correction near previous support levels.
Conclusion
Overall, Akamai Technologies demonstrates positive momentum with its price action reflecting strong technical supports. However, investors should be mindful of possible corrections as the price approaches historical resistance. The upward trend may offer additional growth opportunities, yet risks associated with broader market volatility should not be overlooked. For analysts, closely monitoring price movements around critical Fibonacci levels will be essential for forecasting future price paths and strategic entry points.
Smart Data Insight
Master the Perfect Entry & Exit for this Stock
Don't leave your profits to chance. Historically, this stock follows specific seasonal patterns that institutional traders use to maximize returns.
- ✅ Identify the "Golden Buying Window"
- ✅ Avoid high-risk correction cycles
- ✅ Backtested data from the last 20+ years