August 19, 2025 a 06:45 am
AKAM: Fibonacci Analysis - Akamai Technologies, Inc.
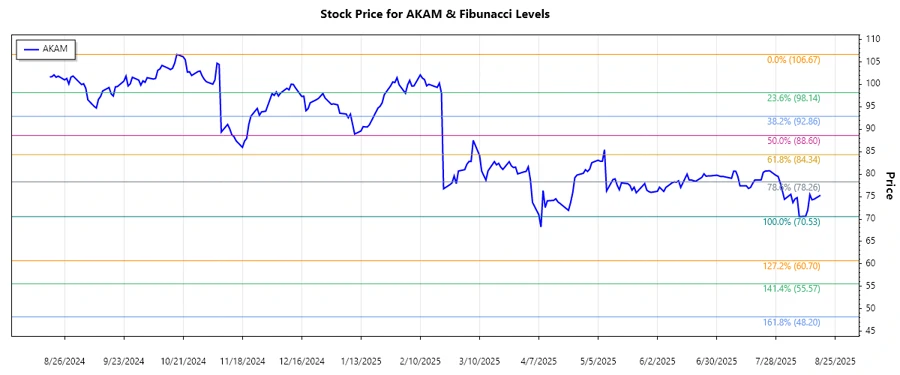
Akamai Technologies, Inc. has exhibited a strong downtrend in recent months, reflecting overall market volatility. With a focus on cloud services and cybersecurity, Akamai's long-term growth potential is significant. However, investors should be cautious of short-term technical triggers that may suggest further declines before stabilization. The current analysis utilizes Fibonacci retracement to identify potential reversal levels.
Fibonacci Analysis
| Detail | Value |
|---|---|
| Start Date | 2024-11-06 |
| End Date | 2025-08-18 |
| High Point | $106.67 (2024-10-18) |
| Low Point | $70.53 (2025-08-08) |
| Fibonacci Level | Price Level |
|---|---|
| 0.236 | $79.64 |
| 0.382 | $84.52 |
| 0.5 | $88.60 |
| 0.618 | $92.67 |
| 0.786 | $98.15 |
Currently, the price is in the 0.236 retracement zone, suggesting a potential resistance level before the price may test lower levels again. This retracement could serve as a pivotal support level if the price manages to break above this resistance area.
Conclusion
Akamai Technologies, Inc. has been on a significant downtrend, breaking major supports, which raises concerns for further declines. However, its fundamental strengths in cybersecurity and cloud services present long-term opportunities. Short-term traders should be aware of the Fibonacci levels as potential resistance or support, which might lead to partial retracements. While the stock's current position within the 0.236 retracement zone hints at possible resistance, overcoming this level could initiate a bullish reversal. It's crucial to monitor these technical levels for informed decision-making in the coming months.
Smart Data Insight
Master the Perfect Entry & Exit for this Stock
Don't leave your profits to chance. Historically, this stock follows specific seasonal patterns that institutional traders use to maximize returns.
- ✅ Identify the "Golden Buying Window"
- ✅ Avoid high-risk correction cycles
- ✅ Backtested data from the last 20+ years